Unified Growth Solution
World-class tech needs world-class drivers. AI platform and expert services, unified
Order a free copy of the Positionless Marketing book
Claim your copyRead time 9 minutes
Exclusive Forrester Report on AI in Marketing

As a marketer or retention expert, you are spending plenty of time and money on your customer retention campaigns. This article will discuss how to measure the effectiveness of your campaigns – in monetary terms – in order to optimize future campaigns and maximize the revenues they generate. In other words, we're going to explore how to treat every campaign as a "marketing experiment."
Many marketers use email open rates and click rates as their primary means of measuring campaign effectiveness. These metrics may provide important insight into brand strength and customer engagement, as well as aspects of the actual email campaign (e.g., the offer, the subject line and the template visuals). However, these metrics provide no indication of what customers did on your site after they clicked on the campaign. Even more importantly, the standard response metrics tell you nothing about the monetary uplift generated by the campaign – and this should be the most important metric you're looking at.
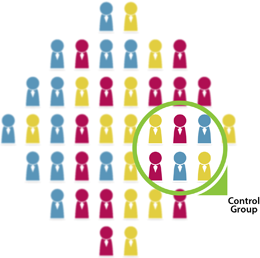
The key to determining the effectiveness of any customer marketing campaign is the proper use of a control group. A control group is a subset of the customers you're targeting with a particular campaign who you decide will not receive the campaign.
The members of the control group are randomly selected to represent the entire target group of customers. In other words, they should be similar to the members of the entire group and thus be exposed to the same set of conditions, except for the particular marketing campaign being tested.
For example, let's say that an online retail marketer has performed some customer segmentation to select 10,000 customers to receive a particular offer. He will send this campaign to only 9,500 of them (the "test group"), setting aside a randomly selected subgroup of 500 customers (the "control group") who will not receive it. Once the campaign is over, the marketer will determine the effectiveness of the campaign by comparing the additional revenues generated by the test group with those generated by the control group.
It is very important that the control group is a representative sample of the overall campaign population. When the control group size is large enough, the process of random selection will always result in a control group that effectively represents the entire group.
The sample size you need depends on the size of the overall campaign population. For 10,000 customers, as in the example above, 5% is sufficient. As a rule of thumb, smaller campaigns require a larger percentage to generate a valid control group. So, for campaigns targeting less than a couple of thousand customers, it's a good idea to use 10%-20% instead.
There is one additional factor to consider when deciding upon the size of your control group: your expected response rate. When you expect a particularly low response rate for a particular campaign (for example, when sending an offer to long-dormant "churn" customers), you will need a larger control group in order to obtain statistically significant results. On the other hand, if you expect a particularly high response rate (for example, sending a bonus to your best customers), a smaller control group will be sufficient.
You can use Excel to easily extract a control group from any list of customers. See the Appendix to this post below for detailed instructions.
Let's imagine that, before starting to use control groups, you sent a marketing campaign to all 1,000 of your best customers. You offered them a 10% discount on every product in your store for one full week.
The campaign's metrics might have looked like this:
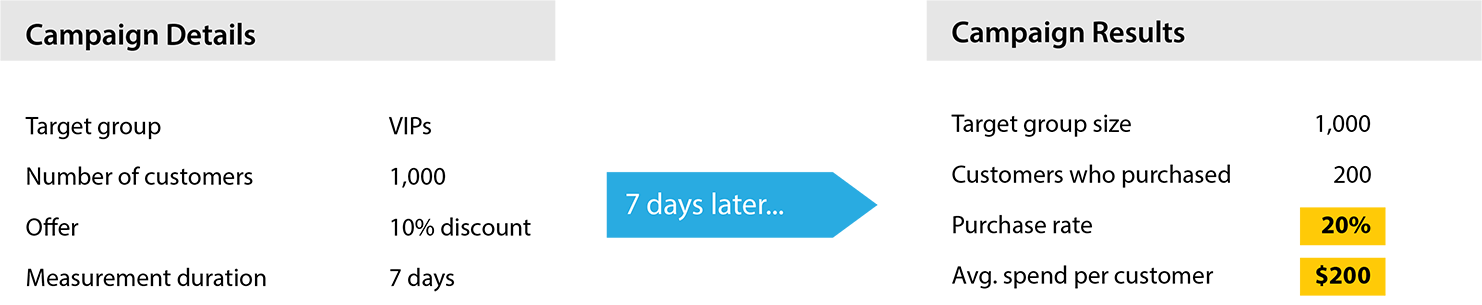
At first glance, the campaign results look terrific! 20% is a high response rate, and 200 customers spending an average of $200 apparently generated an additional $40,000 of revenue in one week!
But wait: since you didn't run this campaign as a marketing experiment, you really have no way of knowing how many of these 1,000 customers would have made a purchase this week anyway, or how much of this $40,000 would have been spent by these customers even without the campaign.
One might think that by simply comparing the purchase rates and spend amounts of a similar group of customers from a previous time period (when no campaign was run) to the current period (in which the campaign ran) can reveal how much additional revenue was generated by the campaign. The reason that this comparison is not valid is that there are always numerous other factors affecting customer behavior from one period to another. It is crucial that the comparison between the test and control groups is made during the same time period.
If you had run this campaign as a marketing experiment, using 10% of the target customers as a control group (who did not receive the campaign), the campaign's results might have looked like this:
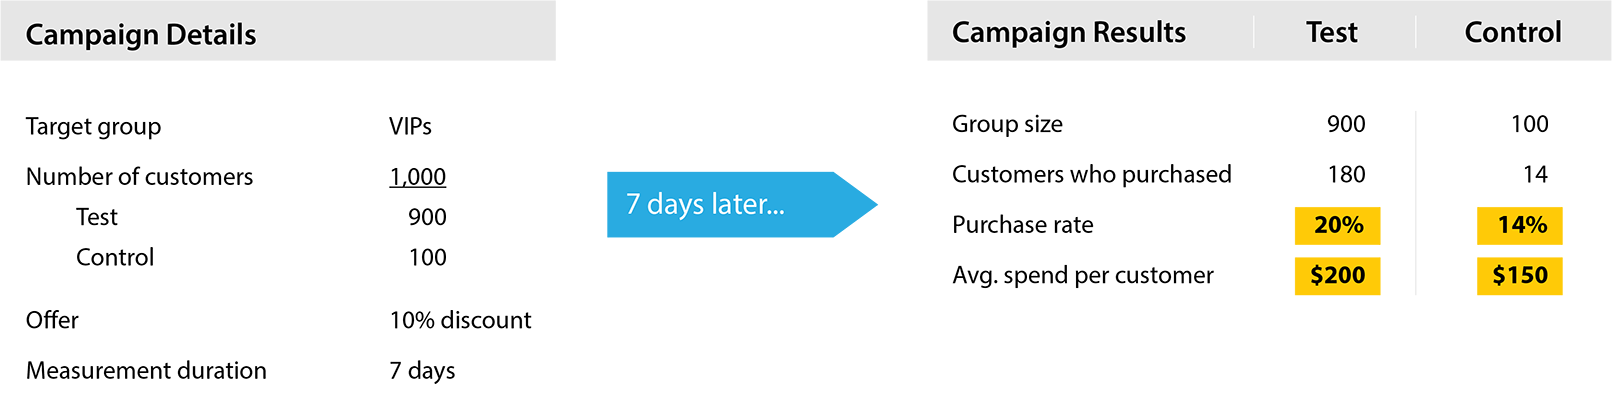
Let's take a look at the control group. Even without receiving any offer, 14% of your best customers made a purchase from your store during the week in question anyway! They spent an average of $150 each. Since the control group represents the entire target group, we can extend the control group's buying behavior to represent the scenario that no campaign had been run at all. Thus, we could have expected that, absent any campaign at all, the entire target group would have made purchases totaling $21,000 (1,000 customers x 14% x $150).
So the question we need to answer is: how much additional revenues resulted from the marketing campaign? (For the sake of simplicity, we are not considering any costs to the company of offering the 10% discount, although including this in the calculations would be straightforward.)
In actuality, the set of all 1,000 of your best customers spent $38,100 this week: the 180 customers who received the campaign spent a total of $36,000 plus the 14 customers who didn't receive the campaign spent an additional $2,100.
Thus, the actual gain generated by this marketing campaign is $17,100 ($38,100–$21,000), a far cry from the $40,000 apparent gain we concluded before using a control group.
In conclusion, treating this campaign as a marketing experiment allowed us to obtain an accurate understanding of the campaign's actual success.
Using control groups, you can determine the actual monetary uplift of every marketing campaign. By testing many campaigns, and keeping close tabs on the true effectiveness of each, you will be able to gradually optimize all your marketing campaigns for maximum financial results (as well as improved customer retention and customer engagement).
To retain the integrity of the results, it is important to ensure that no additional factors under your control are influencing customer behavior. In other words, during the measurement period of a particular campaign (usually a number days), the test and control groups should not be exposed to any other targeted offers or incentives. If customers are receiving multiple simultaneous campaigns, it becomes impossible to measure the effectiveness of any one campaign. In our experience, many marketers fail to realize the importance of isolating their marketing experiments.
Thus, keeping track of which customers are within the duration period of other campaigns and excluding them from any additional concurrent campaigns is a crucial aspect of selecting target customer groups for any marketing campaign.
Selecting target groups for campaigns, extracting valid control groups and analyzing all of the results is not an easy process to perform manually (e.g., using Excel). This is especially true for companies running dozens of marketing campaigns every month, including regularly recurring ones for particular target groups (e.g., new customers, VIPs, customers at risk of churn).
It is far more advisable to use software that can automate this process. Our Optimove customer modeling and campaign management system can do this for you. Optimove automatically selects lists of customer IDs based on defined targeting criteria and then can automatically select a valid random control group of the ideal size. After the campaign measurement period concludes, the software will calculate the financial uplift generated by each campaign (as well as other key metrics). Ultimately, Optimove makes every campaign into a measurable marketing experiment which feeds the software's self-learning recommendation engine.
The analysis methodology discussed in this post is the basis of all good campaign analysis. In my next post, I will delve deeper into additional approaches of analyzing and optimizing campaign performance. Stay tuned...
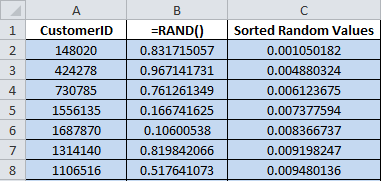
You can use Excel to easily extract a control group as follows (click here to open an Excel file demonstrating this approach):
Exclusive Forrester Report on AI in Marketing
In this proprietary Forrester report, learn how global marketers use AI and Positionless Marketing to streamline workflows and increase relevance.


Pini co-founded Optimove in 2012 and has led the company, as its CEO, since its inception. With two decades of experience in analytics-driven customer marketing, business consulting and sales, he is the driving force behind Optimove. His passion for innovative and empowering technologies is what keeps Optimove ahead of the curve. He holds an MSc in Industrial Engineering and Management from Tel Aviv University.