Unified Growth Solution
World-class tech needs world-class drivers. AI platform and expert services, unified
Order a free copy of the Positionless Marketing book
Claim your copyRead time 5 minutes
Exclusive Forrester Report on AI in Marketing
Many businesses which sell consumable products have trouble identifying their customers’ consumption and purchase patterns, and more specifically, when they’re projected to make their next purchase. Customers who have a steady purchase pattern and have passed their expected purchase date might have churned completely. Therefore, timing is everything and engaging these customers at the right moment is crucial.
Products such as cosmetics, ink cartridges, vitamin packs, dog food or even gym membership punch cards are all types of consumable products. Different customers will have different consumption rates – a women with long hair will probably finish a shampoo bottle faster than a man with short hair; a Great Dane will probably consume a 25-pound sack of food faster than a small Chihuahua would; a body builder will probably consume his 5 pounds of protein powder faster than someone who rarely goes to the gym. Some businesses offer a method of subscription, auto-ship or auto-refill to ensure that their product is flowing and that the customers will never run out. However, a significant number of customers choose not to commit to a subscription and prefer to purchase products punctually.
For E-commerce businesses selling such products, it can prove to be very difficult to assume at what rate their different customers will consume their product. The questions of when are they going to run out? and when are they expected to make their next purchase? will keep coming up.
The methodology for detecting when customers with a steady purchase pattern are expected to make their next purchase is constructed of a few simple steps. We would first need to identify the time between purchases of a specific product for each customer, and the amount purchased in each purchase. Next, we would find the consumption rate by dividing the days between purchases with the amount purchased. We now have all the information needed to predict when the customer is expected to make their next purchase and we can apply these in a formula.
For the sake of simplicity, I will illustrate the methodology with an example. However, it can be applied to any business which sells consumable items:
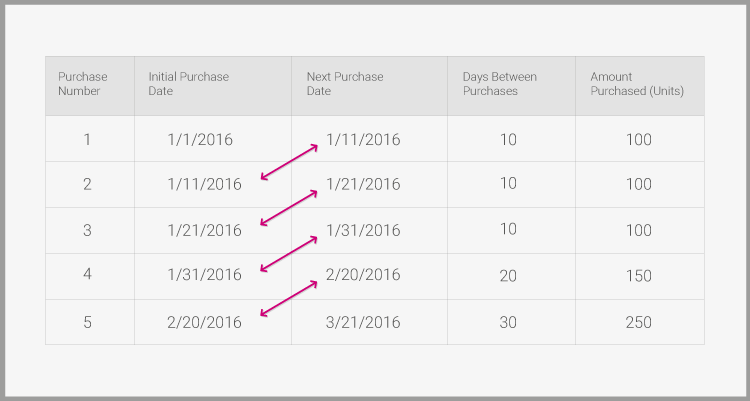
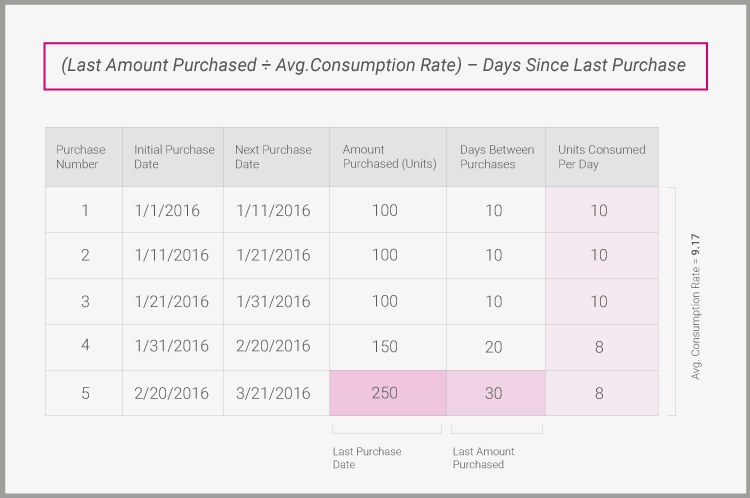
A customer made 5 purchases of the same product on different days. Each time he or she purchased a different amount of the product. We will list the dates that purchases were made and the following purchase dates to calculate the days between purchases. We will also add the amount purchased in the initial purchase (of each row). The amount in this case can be translated into the number of units in a pack, weight, value (if it affects the consumption rate – e.g. a $10 credit which would last twice as much as $5 credit) etc.
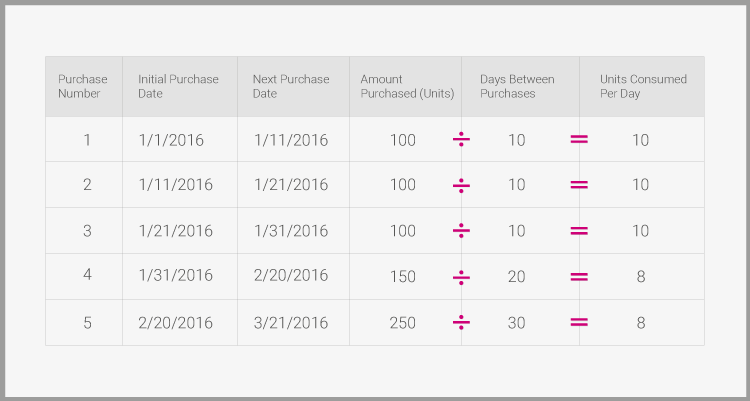
The next step is to divide the amount purchased by the days between purchases to get the consumption rate - the number of units consumed per day. In this simple example, we can see that the consumption rate of this customer is super steady. He or she initially consumed 10 units per day and then reduced their consumption to 8 units per day.
The average consumption rate is 9.17 units per day.
Obviously, in the real world, a significant proportion of customers won’t have this steady behavior.
To detect these steady customers, we will utilize a measure called the coefficient of variation (CV), a statistical measure to compare between data series. This metric will help us create a threshold to define who will be considered a customer with a steady consumption pattern (=low CV), for whom we’ll be able to predict the next purchase. Here’s how:
For each customer, we calculate the standard deviation of the units consumed per day (1.05 in the example above) and divide it by the average consumption rate of the whole customer base. By creating a scatter plot for all the customers’ CV we get a distribution of the CV in the customer base. The distribution might look something like this:
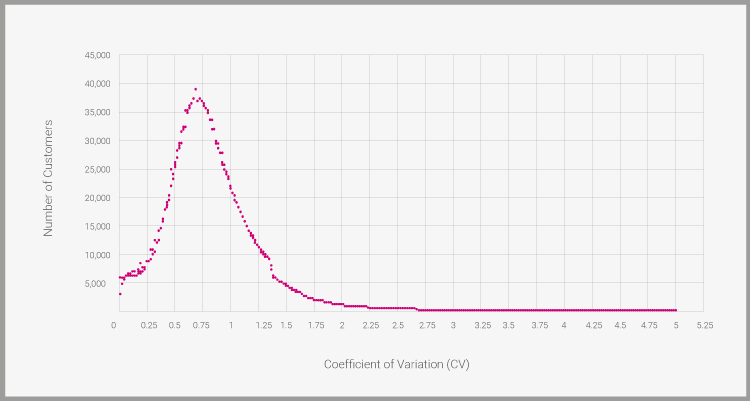
In this example, the lion-share of customers have a CV of 0-1.5, and few customers have a very high CV (ultra-high instability), which can be seen in the right tail of the distribution.
By transforming the distribution above into a cumulative distribution function, we can see the percentiles of customers and their matching CV.
In the example below, the bottom 25% of customers, which are the customers with the steadiest consumption behavior, have a CV of 0.56 and under.
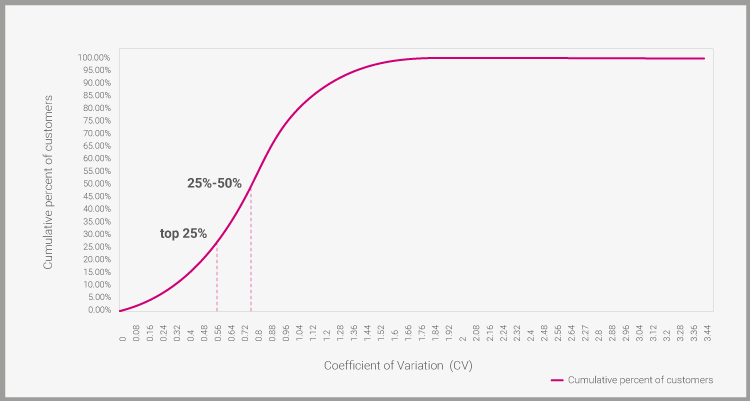
A rule of thumb we may apply to differentiate stable customers from unstable ones, could be classifying customers with a CV lower than the median as stable customers (0.75 in the chart above).
Now that we found the way to detect the customers with a stable consumption pattern, we go back to our original example and translate the information into a prediction – when is the customer going to make their next purchase?
We retrieve the prediction by using the following formula:
As an example, if today’s date is April 21st 2016, this is how the equation would look like:
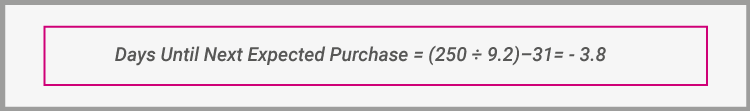
This means that the customer was expected to purchase four days ago. Since this customer had such a steady purchasing pattern, this should alarm us to the fact that the customer is in risk of churning.
This methodology is intended to help marketers and analysts alike understand their customers’ purchase patterns. More specifically, it is intended to help them identify the customers with a steady purchase behavior and when they’re expected to make their next purchase. By doing so, they can act precisely on the churning point and not wait for the next general CRM campaign.
Exclusive Forrester Report on AI in Marketing
In this proprietary Forrester report, learn how global marketers use AI and Positionless Marketing to streamline workflows and increase relevance.

Writers in the Optimove Team include marketing, R&D, product, data science, customer success, and technology experts who were instrumental in the creation of Positionless Marketing, a movement enabling marketers to do anything, and be everything.
Optimove’s leaders’ diverse expertise and real-world experience provide expert commentary and insight into proven and leading-edge marketing practices and trends.