AI and the Retail Marketer’s Future
How AI transforms strategy and processes, driving the adoption of Positionless Marketing
Read time 5 minutes
Forrester: Optimove’s Total Economic Impact
Why it matters:
These case studies from Kentucky and Pennsylvania Lotteries showcase the benefits of using A/B testing and CRM segmentation on Facebook, directly leading to increased player engagement, higher conversion rates, and improved ROI. Understanding and implementing these innovative strategies can drive similar success in other lottery brands.

Both Lotteries used a control group that was an evergreen broad prospecting audience consisting of demographic and some interest and behavioral customer segments.
#1 – A/B Testing on Facebook
Kentucky Lottery conducted an A/B test on Facebook to determine the effectiveness of using a lookalike audience rather than a broad-interest audience for its advertising efforts.
#2 – Utilization of CRM Segmentation
Kentucky Lottery’s goal was to Leverage high-value player segmentation, employing data available in Optimove to create a customized lookalike audience and comparing it against the existing series of their Facebook advertising acquisition-focused ads.
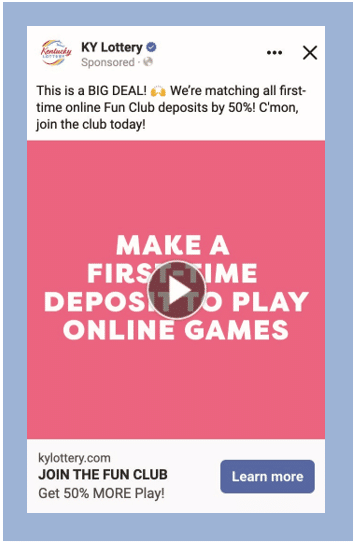
The test was for a first-time deposit offer – as shown in the image above. The test group used Optimove’s high-value player segments, composed of approximately 138K existing players (before match rates on Facebook) with the highest future value of all player accounts.
#3 – Concerns and Challenges
Kentucky Lottery Outlined the attributes of the ideal lottery player, guiding the brand’s demographic and interest audience strategies. However, a deeper consideration revealed that CRM segmentation, which relies on historical player behavior, plays a pivotal role. Relying solely on past data may not capture current trends or shifts in player demographics.
#4 – Key Performance Indicators (KPIs)
The KPI was cost-per-result (purchase conversion). The secondary metrics tracked and evaluated were registration conversion, impressions, and clicks. The lookalike audience was more effective in reaching and engaging users than broad acquisition audiences, and the 20% higher reach indicated greater responsiveness of the lookalike audience to the content or advertisement.
Additionally, there was a 256% increase in clicks, suggesting a significantly higher clickthrough rate for the lookalike audience and reflecting a strong resonance between the content and the preferences or characteristics of this audience. The 31% increase in registrations and 3% increase in purchases demonstrate that lookalike audiences, not only clicked more frequently, but also took desired actions aligning with the campaign’s objectives.
#5 – Test Results
Kentucky Lottery enhanced its acquisition strategy by crafting lookalike audiences using high-value players. This approach ensures that advertising investments are strategically directed towards initially engaging higher-quality players. Simultaneously, the broad prospecting audience remains instrumental in capturing the interest of potential players in the consideration phase of their journey, thereby creating a synergistic and comprehensive approach to player acquisition.
#1 – A/B Testing on Facebook
Pennsylvania Lottery ran an A/B test on Facebook to measure the efficiency of employing a lookalike audience versus a broad-interest audience. The test group used Optimove’s high-value player segments, composed of approximately 46,000 existing players with the highest future value of all player accounts.
#2 – Utilization of CRM Segmentation
They used player data to create a customized audience like high-value players and test it against the current ad series, mainly the Welcome Offer. The lottery brand used Facebook to create CRM segments with similar lookalike traits to those of high-value players. Exclusion lists ensured ads were served to people not registered with the Pennsylvania Lottery.
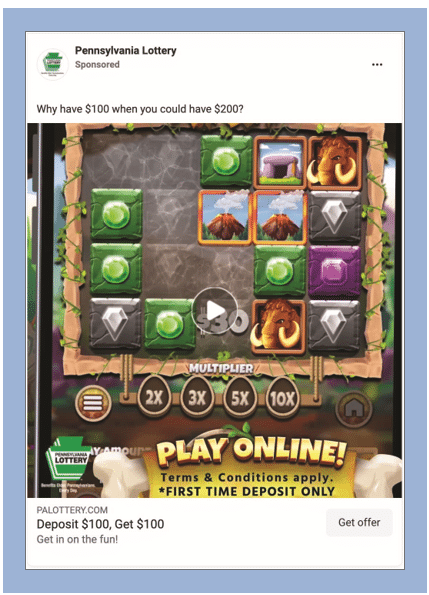
As shown above, the creative featured the progressive jackpot game Cave Quest, promoting various welcome offers.
#3 – Concerns and Challenges
Before executing the A/B test on Facebook, several concerns were raised over the experiment’s integrity, particularly the potential duplication of audiences between the test and control groups. Another concern was the impact on the control group’s performance by excluding the lookalike audience. Lastly, the prospect of increased costs incurred by a successful test group posed a financial dilemma.
#4 – Key Performance Indicators (KPIs)
Pennsylvania Lottery’s KPIs included cost-per-first-time deposit (CPFTD), return on ad spend (ROAS), deposit conversion, and average first-time deposit. The test group demonstrated outstanding performance, achieving a remarkable 60% decrease in the cost-per-first-time deposit, a substantial 67% reduction in the cost-per-deposit, and an impressive 42% increase in conversion rates compared to the control group.
Although the control group boasted a slightly higher average first-time deposit by about 2%, the test group proved more profitable overall based on primary KPIs such as CPFTD, ROAS, and deposit conversion.
#5 – Test Results
Pennsylvania Lottery’s assessment of the future value of customers within the Optimove platform indicated a substantial increase during the test period, jumping from $266-$353 to a solid $412-$442 during the test period. Therefore, separating the lookalike audience from the broad prospecting audience significantly boosted the performance of this lottery brand.
Kentucky and Pennsylvania Lotteries used A/B testing on Facebook to compare lookalike and broad-interest audiences, achieving significant results. Kentucky Lottery utilized Optimove’s high-value player segmentation for customized lookalike audiences, while Pennsylvania Lottery targeted unregistered users using CRM segments. Challenges included Kentucky’s concern over outdated data and Pennsylvania’s issues with audience duplication and costs. Kentucky achieved a 256% increase in clicks, and Pennsylvania reduced the cost-per-first-time deposit by 60%.
Lottery brands should consider employing these strategies to boost player loyalty and ROI. For more insights, request a demo.
Forrester: Optimove’s Total Economic Impact

Jeff Laniado has led iGaming sales for Optimove in the US and Canada for over four years, working with top operators in sports betting, iCasino, DFS, sweepstakes, and lottery.
He is responsible for managing many of the US-focused iLottery partnerships. Jeff has more than a decade of experience in sports, gaming, and promotional marketing strategy and sales.