Unified Growth Solution
World-class tech needs world-class drivers. AI platform and expert services, unified
Order a free copy of the Positionless Marketing book
Claim your copyRead time 5 minutes
Exclusive Forrester Report on AI in Marketing

Customer survival analysis, also known as retention rate analysis, is the application of statistical techniques to understand how long customers remain active before churning. The information generated by this analysis helps improve customer acquisition and retention activities. Survival analysis is always based on tracking a cohort of customers over time.
Cohorts are unchanging groups (i.e., no new customers join a cohort once formed) who are tracked over time. The most common type of cohort is the group of people who became customers in a particular time frame, e.g., a particular date, the second week of the month of January, or the fourth quarter of the year.
There are two primary methods of analyzing the retention rates of your customers. The following image presents both methods using charts and graphs that (hopefully) make it easier to understand each and compare them. This example looks at five people who signed up at a fictional website. The top section shows on which days, during a two-week period, each customer was active on the website. (Click any chart any enlarge it.)
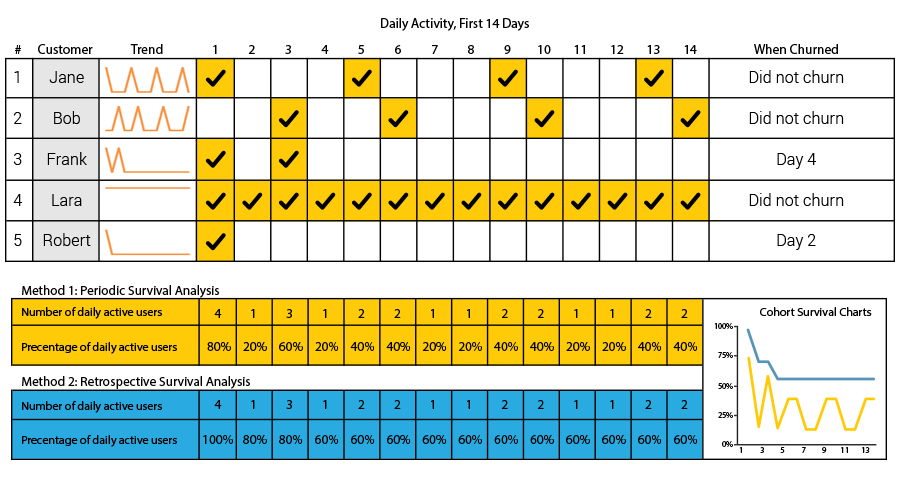
For a periodic survival analysis, we monitor whether or not each customer was active in each period of time (the periods in this example are days). We tally the number of customers who had some activity in each period and track the percentage of active customers, from among all customers in the cohort, in each period. In our example, the number of active users and period survival percentage for each day is seen in the orange bar:
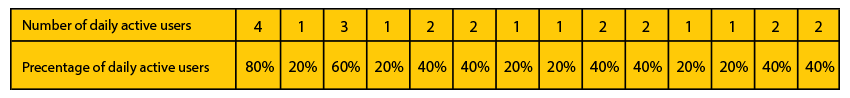
[Note: The period used depends on the type of business it is. For online gaming (e.g., social gaming and real-money gaming sites) and daily-use apps (e.g., messaging, GPS), the measurement period would be days. For retail sites, it might be weeks or even months.]
Using this method, we focus on the actual customer activity in any given period providing realtime, ongoing insight into the activity level of every cohort. Another advantage of the periodic method is that it is very simple to implement. On the other hand, this method does not effectively represent a regular customer who is only active every now and then, such as Jane in our example. Although Jane is a consistently active customer (exhibiting activity every four days), the percentage of “active users” will not reflect this fact on a daily basis.
The retrospective survival analysis approach assumes that every customer is active until they have been inactive for a particular length of time. In our current example, the inactivity period to determine churn is 10 days (the ideal inactivity period used to designate a customer as churn differs from business to business). Thus, as indicated in the far-right portion of the chart, Frank churned on day 4 and Robert on day 2.
The blue bar shows the number and percentage of “survivors” in each period using this method.
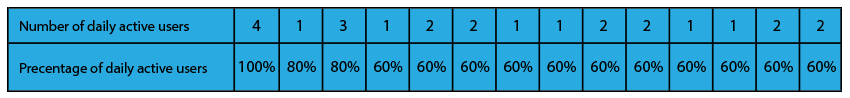
Unlike the periodic method, the retrospective method identifies an actual period in which each customer churned. On the other hand, we can obviously only determine that a customer churned on a particular day by waiting 10 days to see that he/she never came back. Thus, this method is only useful by looking back on customer activity after some minimum duration of time has elapsed (hence the name, retrospective survival analysis).
So the retrospective method’s main advantages are that it provides a more accurate understanding of when your customers are actually churning and it also presents a much better overall picture of the rate at which you are losing customers.
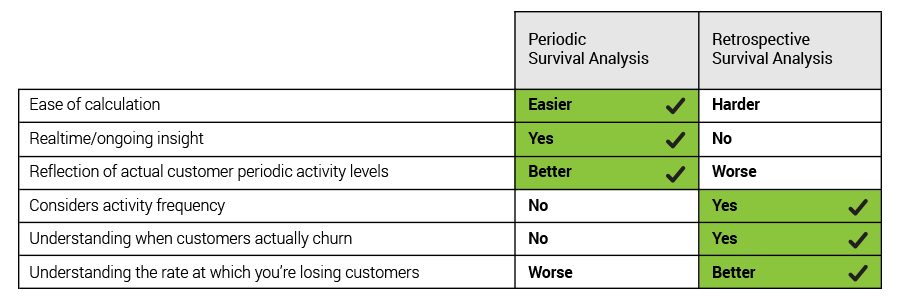
The following chart summarizes the pros and cons of each method:
Survival analysis is one of the cornerstones of customer analytics. It is a key factor in understanding how your customers behave in relation to your business, and it’s a frequent contributor to those “Aha!” insights which can lead to major improvements in the product and marketing efforts.
Some of the practical benefits that retention marketers can quickly realize from using survival analysis are:
Survival analysis is also an important factor in basic LTV calculations: the expected future monetary value represented by a customer is obviously a factor of how long that customer will remain active with your company.
The two methods of analyzing customer retention described here provide different perspectives on your customers and their survivability over time. Each has its advantages and its disadvantages. Our recommendation is to use both methods in order to gain the maximum customer analytics value. By closely tracking churn rates, you will be in a much better position to implement churn prevention efforts, evaluate customer lifetime value per source/date/location and optimize the timing of your retention marketing campaigns.
Exclusive Forrester Report on AI in Marketing
In this proprietary Forrester report, learn how global marketers use AI and Positionless Marketing to streamline workflows and increase relevance.


Pini co-founded Optimove in 2012 and has led the company, as its CEO, since its inception. With two decades of experience in analytics-driven customer marketing, business consulting and sales, he is the driving force behind Optimove. His passion for innovative and empowering technologies is what keeps Optimove ahead of the curve. He holds an MSc in Industrial Engineering and Management from Tel Aviv University.