

Unified Growth Solution
World-class tech needs world-class drivers. AI platform and expert services, unified
Read time 8 minutes


Engage at the speed of your customer.
Why it matters:
This post shows iGaming marketers how the number of bettors participating differs between the two biggest men’s tennis events on the calendar, and what that means for where campaign budget should sit during the US Open and Wimbledon. Readers will learn why finals-weekend betting behaves differently at Flushing Meadows than at Wimbledon, and how to size promotions and retention triggers by tournament stage and by market.

Key takeaways:
Wimbledon is the marquee tennis event. That isn’t in dispute, and the betting data doesn’t challenge it. Wimbledon’s final is the single biggest cross-market betting moment on the tennis calendar.
What the data does indicate is that marquee status and total engagement aren’t the same thing. Across 2025, the two tournaments generated broadly similar bettor engagement. What differs is how that engagement distributes across rounds. That distribution, not the headline prestige, is what should drive where operators put budget, staffing, and campaign weight ahead of August 30.
To compare the same tournament year, Optimove Insights analyzed more than 897,000 bettors who placed over 14.8 million bets during the 2025 Wimbledon (June 30 – July 13) and US Open (August 24 – September 7) Men’s Singles tournaments, across both UK and US markets. Activity was broken into four tournament stages (Initial Rounds, Quarterfinals, Semifinals, and Finals) and benchmarked against average daily betting activity in comparable non-tournament periods immediately preceding each event.
One caveat shapes how these numbers should be read: the rounds do not offer equal opportunity to bet. The initial rounds span roughly 120 matches across eight days; the final is a single match on a single afternoon. Participation figures are therefore not comparable within a tournament from one round to the next, but they are directly comparable across tournaments at the same round, which is how every comparison below is drawn.
Averaged across UK and US bettors, the two tournaments trace almost the same line, right up until the last match.
Side note: At Wimbledon, Sinner defeated Alcaraz 4-6, 6-4, 6-4, 6-4. At the US Open, Alcaraz defeated Sinner 6-2, 3-6, 6-1, 6-4.
Participation, throughout this analysis, is the percent of total bettors by country who placed at least one bet during a given round.
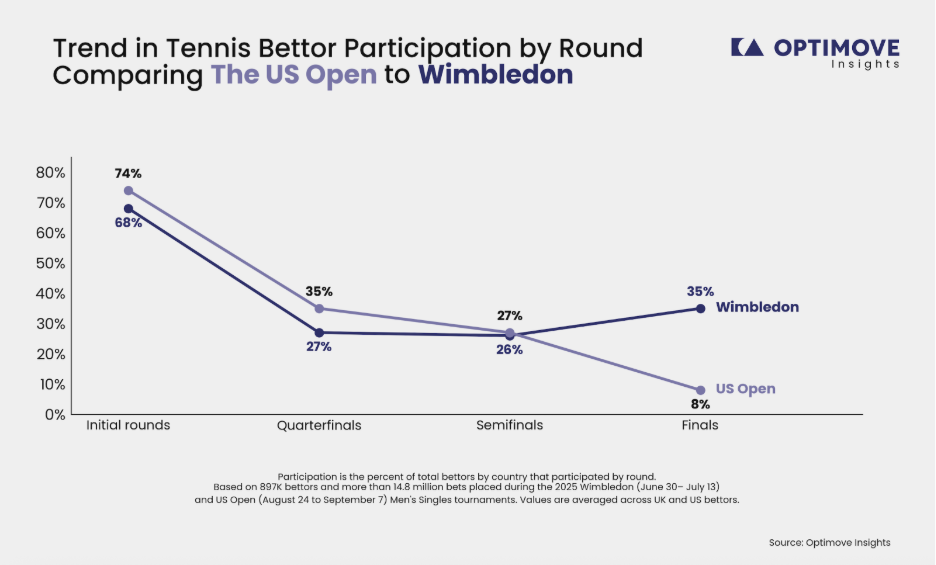
Tennis bettor participation by round, US Open vs. Wimbledon, averaged across UK and US bettors. Source: Optimove Insights.
Through the first three rounds the curves run close together. The US Open sits modestly higher at the initial rounds (74% vs. 68%) and more clearly at the quarterfinals (35% vs. 27%), and by the semifinals the two are level at 26–27%.
Then they diverge. Wimbledon’s final pulls lapsed bettors back, rising from 26% at the semifinals to 35%. The US Open falls the other way, from 27% to 8%.
The obvious explanation would be matchup quality: that Wimbledon drew a marquee final and New York drew a dud. It didn’t. Both 2025 finals were contested by the same two players: Jannik Sinner and Carlos Alcaraz, the world No. 1 and No. 2. Sinner won at Wimbledon in four sets on July 13; Alcaraz returned the result in four sets at Flushing Meadows on September 7, reclaiming the top ranking. It was their third consecutive Grand Slam final.
Two finals, the same two players, the best matchup the sport can produce, and a participation gap of 35% to 8%. That rules out the draw as the cause. The difference is structural to the tournament itself: its timing in the calendar, its cultural pull, and what it asks of a casual bettor on the final Sunday.
The engagement is comparable. The curve is not.
Wimbledon is U-shaped, shedding bettors through the middle rounds and recovering them for a final that is genuine appointment viewing. The US Open is a descending staircase: strong early, healthy through the middle weekend, and then a final that doesn’t bring anyone back. No amount of finals-weekend promotional spend manufactures the pull that Wimbledon has by default.
Splitting each tournament into UK and US bettors shows the pattern isn’t an artifact of averaging. It holds in both markets independently.
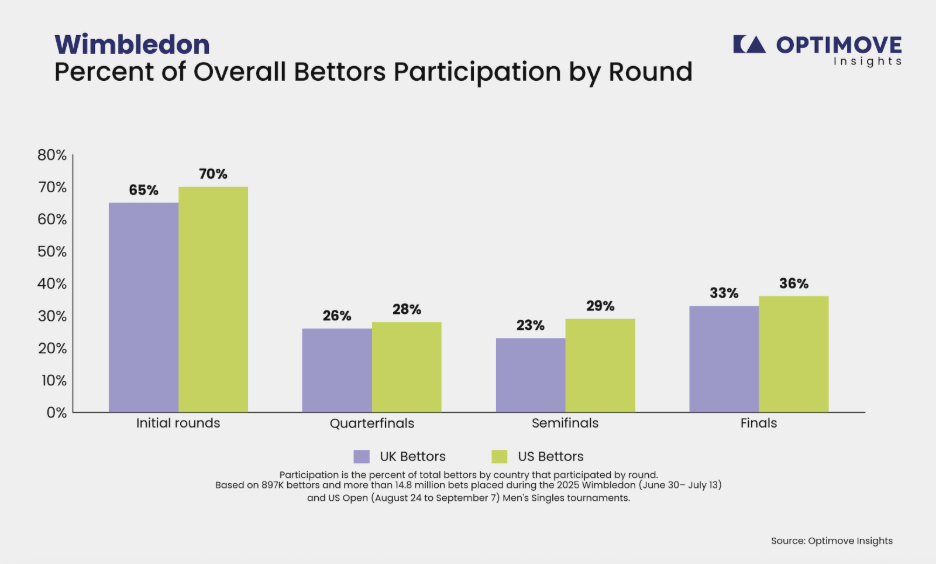
Wimbledon 2025: percent of overall bettor participation by round, UK vs. US. Source: Optimove Insights.
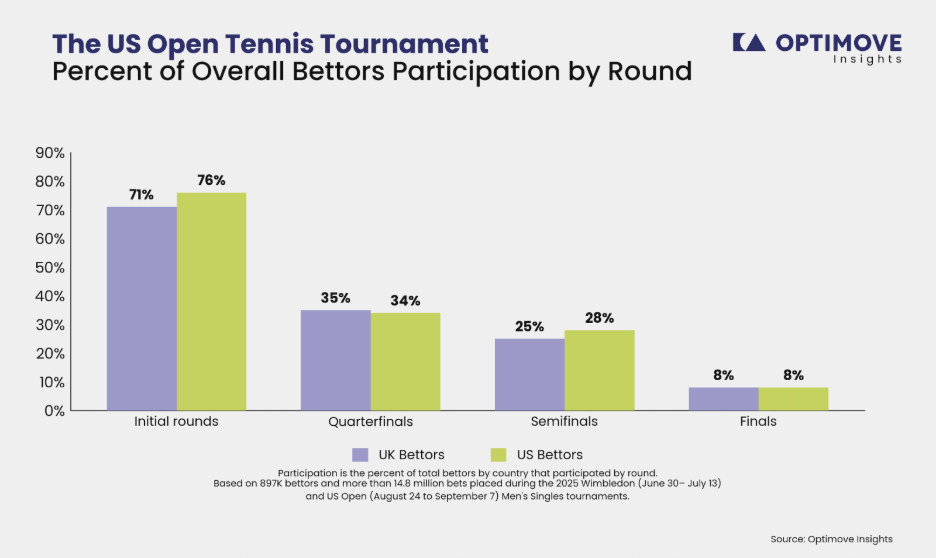
US Open 2025: percent of overall bettor participation by round, UK vs. US. Source: Optimove Insights.
At Wimbledon, both markets dip to 23–29% at the semifinals and recover to 33–36% for the final. At the US Open, both fall to 8%, identical in the UK and the US, despite the US being the domestic market. The final’s failure to convert is not a market-specific problem.
One local difference is worth noting: UK participation at the US Open quarterfinals reaches 35%, against 26% at their own home Slam. The away tournament’s middle weekend outperforms the home one.
Most tournament playbooks are built like a pyramid: modest early spend escalating toward a finals crescendo. On the US Open, that points money at the one round where the audience isn’t.
The practical version: Sportbooks’ US Open campaign needs to be finished and live before the tournament starts, and your retention window closes earlier than instinct suggests.
Before August 23 (Fan Week)
August 30 – September 2 (Initial Rounds in 2026)
Through the Semifinals
Finals Weekend
The US Open and Wimbledon ask for the same total investment in tennis and reward it on completely different schedules. Wimbledon lets operators build toward a final that delivers. The US Open front-loads its audience and never gets them back, which makes the opening week and the middle weekend the moments that decide the tournament commercially.
For CRM Marketing teams, the question of when a campaign should peak becomes the difference between spend that lands and spend that arrives after the audience has left. Segmenting by round-level participation and by market stake profile is what separates a US Open plan from a Wimbledon plan run six weeks later.
That’s Positionless Marketing in practice: marketers acting on behavioral data as it moves, sizing campaigns to where players actually are rather than where the tournament bracket suggests they should be.
For more insights, contact us to request a demo.
Analysis based on 2025 Men’s Singles betting activity across UK and US markets. Women’s Singles behavior was outside the scope of this dataset. Participation figures reflect differing match volumes by round and should be compared across tournaments at the same round rather than between rounds.
Download the Increasing the Value of New Online Gaming Players report and discover proven methods to increase new player deposits, retention, and lifetime value when empowered by Positionless Marketing


Rob Wyse is Senior Director of Communications at Optimove. As a communications consultant, he has been influential in changing public opinion and policy to drive market opportunity. Example issues he has worked on include climate change, healthcare reform, homeland security, cloud transformation, AI, and other timely issues.