

Unified Growth Solution
World-class tech needs world-class drivers. AI platform and expert services, unified
Read time 19 minutes


iGaming Pulse: The daily benchmark for iGaming Operators

Executive Summary :
This is a retrospective of the 2025/26 NFL season, built to help sportsbook operators plan for 2026/27 season. It compares what bettors said they would do before the season started with what 5 million of them actually did across 136 million wagers.
One pattern runs through the findings: bettors described their overall appetite reasonably well and their own behavior poorly.
The difference reveals when stated intentions can guide communication and when relying on them can lead sportsbooks in the wrong direction.
Players anticipated betting during the regular season, using live wagering, and placing mid-sized bets. In practice, regular-season participation exceeded expectations, live bettors became predominantly hybrid bettors, and wager sizes polarized between a large low-stakes audience and a smaller high-value segment.
Season intensity came from participation, not stake size. Daily bettor counts swung 131 points against a non-event baseline while average bet moved within 15. Wild Card weekend, not the Super Bowl, was the heaviest betting stretch of the year.
For 2026/27, sportsbooks should use intent data to understand what appeals to customers, but behavioral data to determine when, where, and how to move. Acting on this gap means reaching the right bettor in the moment that matters, before, during, and after the game, on a schedule the NFL sets and does not hold open.
This is what Positionless Marketing is built for: it enables one single marketer to turn each new signal, such as a pre-game wager, a lapse in activity, or a shift into live betting, into a relevant campaign while the opportunity is still open.
Methodology :
This report compares two datasets covering the 2025/26 NFL season.
Stated intentions come from the Optimove Insights 2025/26 Consumer Report on NFL Wagering Intentions, based on 425 U.S. adults who wager on NFL football. The survey was conducted in August 2025 among respondents aged 21 or older with household incomes of at least $75,000.
Actual behavior comes from an Optimove Insights analysis of 136,211,778 wagers placed by 5,047,205 NFL bettors from the preseason through the Super Bowl.
The two datasets do not represent the same individuals. The comparison therefore shows how stated expectations differed from observed market behavior, rather than proving that specific respondents changed their plans.
Figures may not sum to 100 percent because of rounding.
The regular season was the only phase where actual participation exceeded stated intent. Seventy-three percent (73%) of survey respondents planned to bet during the regular season; 87% of bettors did, a gap of 14 points in the opposite direction.
All other stages attracted fewer bettors than expected:
The rank order of the playoff rounds reversed between intent and behavior. In the betting intent survey, Wild Card was the second-largest draw of the entire season at 48% of betting intentions, ahead of the Super Bowl at 37%.
In actual behavior, the Super Bowl drew more bettors than any other single game at 21%, ahead of the Wild Card at 17% (this is opposed to the Wild Card weekend, which was the heaviest betting stretch of the year).
Stated intent spread over the playoff rounds across a 21-point range, from 27% to 48%. Actual behavior compressed them into an 8-point band, from 13% to 21%.
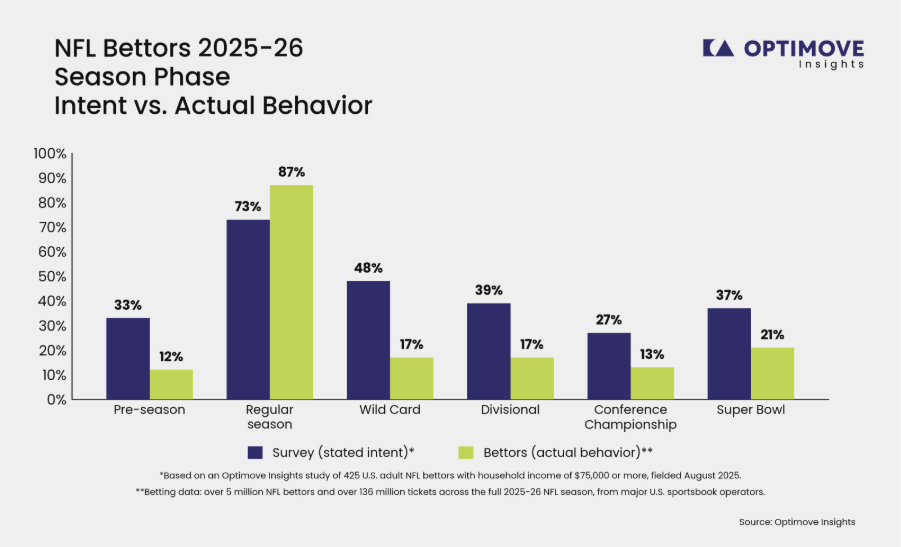
The results separate habitual participation from event-driven interest. Bettors predicted their habits accurately and overestimated their actions during events. That distinction holds across the whole chart.
The regular season is a weekly occasion running five months across 272 games, and it maps to how people bet. At 87%, participation is close to a ceiling: if someone wagers on the NFL at all, they almost certainly wager during the regular season.
The playoffs are a small number of games in a compressed window, seen as events rather than routines.
Pre-season makes the point sharply. The survey was fielded in August 2025, during pre-season itself, so respondents were not forecasting a distant future. They were describing something happening that week, and they still overstated it by nearly three to one.
The playoff decline is not only a function of fewer games. By January, part of the casual base has already lapsed, revealing how much of the regular-season audience remains active.
The contrast between Wild Card weekend and the Super Bowl is especially important. Wild Card generates concentrated activity because six elimination games take place across three days. The Super Bowl, however, carries enough cultural relevance to bring back bettors who did not participate in earlier rounds.
Plan playoff campaigns against behavior, not stated intent. Sportsbooks that sized playoff spend to the survey built for roughly two to three times the audience that arrived. Wild Card intent of 48% against 17% participation is the clearest example of why intent data should inform messaging but not forecasting.
Treat the regular season as the window where breadth is won. A bettor who is not active by December is unlikely to be recruited by the playoffs. Acquisition and habit-building work belongs in the phase where 87% of bettors are already present, not in the rounds where participation has already narrowed.
Approach the playoffs as reactivation rather than acquisition. The playoff audience is a subset of people who were already active. Campaigns aimed at the whole base will mostly reach people who have stopped paying attention. Targeting lapsed regular-season bettors specifically is the better use of the moment.
Concentrate reactivation on the Super Bowl. It is the one event that outperformed the rounds preceding it despite lower stated intent, which makes it the single best opportunity of the year to bring back bettors who have gone quiet.
Read pre-season participation as a signal, not a volume opportunity. The 12% who wagered before the games counted are a small, self-selecting group, and likely among the most engaged in the base. That is worth knowing about them. It is not worth heavy promotional investment against a 33% expectation that resolved to 12%.
This chart shows three types of bets: pre-game only, live only, and both, comparing what bettors expected to do with what they did.
Live-only betting was the format that decline significantly, falling from 31% of intended behavior to 16% of actual behavior, roughly half.
The percentage of bettors using both pre-game and live wagering increased from 21% to 32%, and pre-game only rose from 48% (intentions) to 52% (actual).
Combining the categories that involve each format tells a different story than the individual bars. Bettors who expected to use live betting in some form totaled 52% of intent. Those who actually did totaled 48%. Bettors who expected to use pre-game in some form totaled 69%. Those who actually did totaled 84%.
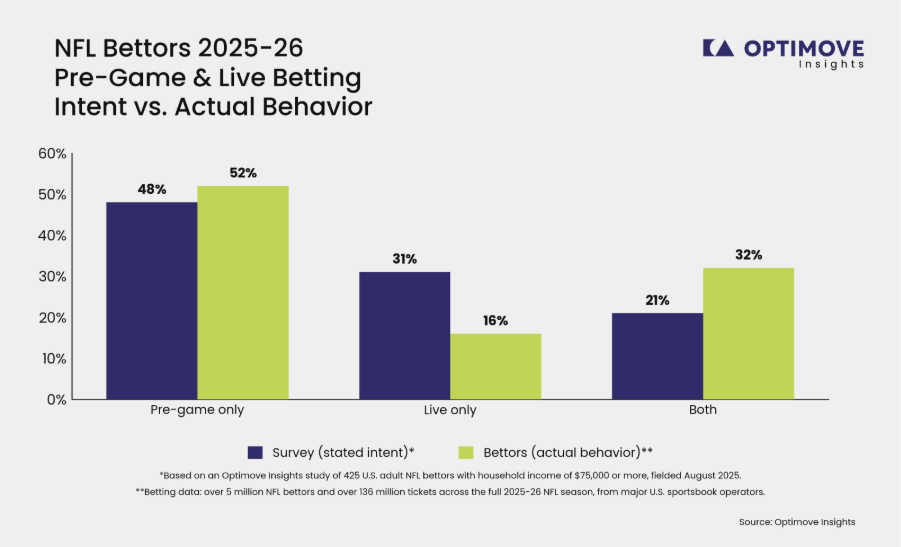
Bettors understood their interest in live wagering, but not how it would fit into their overall behavior. Many who expected to bet exclusively during games ultimately combined live activity with pre-game wagers.
The reason is structural. Pre-game is a decision made in advance, at leisure, and it fits any level of engagement. Live requires the bettor to be watching, with the app open, during the window a market is available. Fewer people organize their betting around that constraint. Many reach for it once a game is already in front of them.
The expansion of the hybrid segment shows that sportsbook journeys should not treat pre-game and live betting as competing behaviors. For a substantial share of bettors, one leads directly into the other.
The question is not which format to promote. It is where to spend and where to stop.
Format behavior identifies VIP candidates. Live betting means watching the game with the app open when a market is live. The 16% who bet live exclusively clear that bar repeatedly, and the 32% using both formats are engaged across more of the product. Neither proves value, since this data does not measure it. Both are candidate signals worth crossing against the deposit and retention data you already hold.
Acquire through pre-game. At 84% participation, pre-game has the lowest barrier: no live viewing, no timing constraint, decisions made at leisure. It is the natural first wager for a new player and the widest surface available.
Do not bonus players who are already engaged. A bettor placing live wagers is watching the game with your app open. That is driven by the game, not by an offer. Bonusing them risks transferring margin to someone who was going to bet anyway.
Spend where a bonus changes behavior. The conversion worth paying for is a pre-game bettor placing a first live wager. The hybrid group came in at 32% against 21% expected, so that shift is happening at scale. Time the offer off the pre-game ticket, when interest and availability are both known.
Design for the hybrid as the default. A third of bettors move between formats within a season. Product and messaging that force a choice between pre-game and live describe a distinction most bettors do not observe.
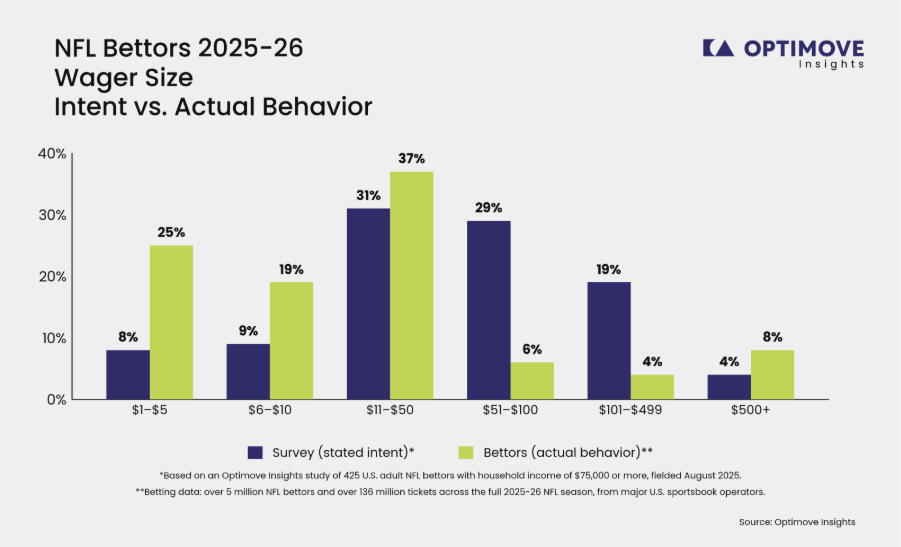
The two lowest ranges were the most underestimated. Expectations put 8% of bettors in the $1 to $5 range. In practice 25% of bettors habitually wager there. The $6 to $10 band went from 9% expected to 19% actual.
The two upper-middle bands came in far below expectation. The $51 to $100 band fell from 29% to 6%. The $101 to $499 band fell from 19% to 4%. The highest band of $500-plus ran the other way, from 4% expected to 8% actual.
Combined, 52% of survey respondents expected to typically wager above $50. In reality, just 18% of actual bettors did.
Combined, 17% expected to typically wager $10 or less. Forty-four percent (44%) of actual bettors did.
Insights
The market is more polarized than bettors stated expectations suggest. Most anticipated placing moderate wagers, but actual activity clustered around two distinct groups: a broad base making small bets and a much smaller segment wagering at significantly higher levels.
This matters because the middle of the market is where many standard promotions are calibrated. Offers built around $50 or $100 qualifying wagers may reflect what bettors say they will spend, but not what most of them consistently do.
Stake size alone also provides an incomplete view of value. A customer placing frequent small bets can generate meaningful activity, while another may place fewer but substantially larger wagers. These behaviors require different engagement and retention strategies.
A note on the two groups being compared:
Even so, the gaps are too big to explain away. The $51 to $100 group fell from 29% to 6%, and the top group doubled.
Design for a barbell, not a bell curve. Nearly half of bettors typically wager $10 or less, and 8% typically wager $500 or more. Promotions and bonus structures calibrated to a $50 to $100 typical wager are built for a middle that turns out to be thin.
Reconsider minimum thresholds on offers. A promotion requiring a $50 qualifying wager is out of reach for the 44% of bettors who habitually stake $10 or less. That is a large share of the base structurally excluded from the offer.
Do not size value from stated stake preference. Expected stake amount intentions sits well above the actual distribution. Models and forecasts built on survey-stated stake size will overestimate the $51–$500 segment of the market.
Separate frequency from stake in segmentation. A bettor placing many $5 wagers and one placing a few $100 wagers can generate similar handle through entirely different behavior, and they respond to entirely different messaging. Stake size alone does not identify a customer.
Treat the $500-plus segment as its own operation. It is twice the size expectations suggested and small enough to serve individually. It is the only band where behavior exceeded expectation, and it carries disproportionate revenue weight.
This section compares average bet amount and number of bettors against a baseline during a non-NFL week in July 2025.
In this comparison, as expected, the number of daily bettors rose in every phase of the season. The average bet amount per bettor stayed close to flat throughout.
Wild Card weekend produced the highest concentration of bettors of any phase, at +156% over baseline.
Bettor volume declined through each subsequent playoff round, from +156% at Wild Card to +71% at the Super Bowl.
Average bet size per bettor fluctuated within a narrow band all season, from −7% to +8% against baseline. The regular season was the only phase below baseline.
The Super Bowl recorded the highest average bet per bettor at +8%, and the lowest bettor volume of any playoff round at +71%. However, the Super Bowl is one game compared to multiple games during the regular season and playoff round, so on a per-game basis, the Super Bowl likely concentrates more bettors into that single game than any other game of the season.
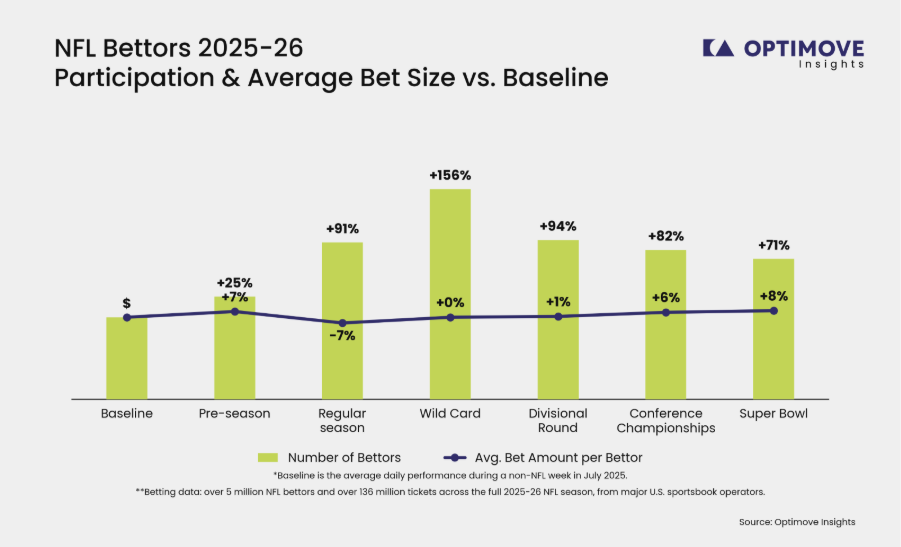
Season intensity is driven by how many people are betting, not by how much each of them wagers. Bettor counts swing across a 131-point range, from +25% to +156%. Average bet size moves within 15 points. Whatever else changes across an NFL season, individual stake behavior barely does.
Wild Card weekend is the densest betting moment of the year. Six games across three days, all of them elimination games, produce more daily bettors than any other point in the season. Read alongside chart 1, this is a specific kind of event: it reaches only 17% of bettors across the season, but the ones who show up all show up at once.
From there the playoffs contract steadily. Each round has fewer games and fewer teams, and each draws fewer bettors than the round before it. The Super Bowl draws the fewest daily bettors of any playoff round, at +71%, though it is a single game rather than a full slate.
The regular season is the only phase where average bet size falls below baseline, at −7%.
The Super Bowl's +8% average bet is the highest of the season.
The practical conclusion is that phase-level revenue is a function of participation. There is no evidence here that big events cause bettors to stake meaningfully more. They cause more bettors to show up, briefly.
The season's shape points to where long-term value is found and where marketing money is wasted. Both live in the regular season.
The regular season is where your best players are. Participation runs high across all five months, which means the bettors who are active week after week, not just for a marquee game, are visible here. These year-round bettors are the base of long-term value. The playoffs draw a narrower, event-driven crowd. The regular season is where the durable customer reveals themselves, simply by continuing to show up.
Find the always-on bettor and build a profile. A bettor active across the full regular season is behaving differently from one who appears only for the Super Bowl. Identify the players who bet all year, then study what else they have in common: how they deposit, which formats they use, how often they return. That profile is the most valuable asset this data points to, because it tells you who your VIPs actually are rather than who says they will be one.
Acquire against that profile. Once you know what a year-round bettor looks like, you can target acquisition at new players who match it, rather than spending broadly and hoping value emerges. This is the difference between buying volume and buying the right volume.
Do not incentivize players who will bet anyway. Stake size barely moves across the season, and the committed regular-season bettor is already engaged by the games themselves. Bonusing that player likely does not create activity that was not already coming and gives away margin. The goal with these players is not to pay them to bet, it is to recognize them, treat them as VIPs, and keep them loyal through service and status rather than subsidy.
Spend incentives where they change behavior. Marketing dollars work when they move someone who would not otherwise act: a new player who fits the profile, or a lapsed bettor worth reactivating. They are wasted on the player already betting every week. Knowing the difference is the whole point of profiling the base.
This report shows that timing is everything in NFL betting. When a bettor acts, and for how long the window stays open, matters as much as who they are. Positionless Marketing is what lets a sportsbook meet each of those moments with the right message while it still counts.
Before the game. This is where relevance is built. A bettor who wagered on the same matchup last week, or who fits the profile of a year-round player, can be reached with a message shaped to what they actually do, not a generic promotion sent to everyone. Pre-game is also the widest surface in the sport, with 84% of bettors placing pre-game wagers, which makes it the moment to acquire new players and set up everything that follows.
During the game. This is the moment the old marketing structure cannot serve. A bettor who placed a pre-game wager has told you they are watching and available for the next three hours. That is the highest-intent window in sports betting, and it closes when the game ends. Reaching them with a relevant in-play prompt, in that window, is not something that can wait for a segment to be built and an offer to be approved by four different people. It has to happen now, or not at all.
After the game. This is where engagement is kept. The result of one wager sets up the next message, whether that is a reactivation aimed at a lapsed bettor before the Super Bowl or a follow-up that keeps a regular-season player active into the following week. Retention is built here, in the space between games.
Positionless Marketing exists to serve all three moments. It lets a single marketer read what a bettor just did, build the audience, shape the message, and deliver it, without waiting on a handoff that outlasts the moment. Every finding in this report points to an action with a clock on it: a pre-game ticket that sets up a live prompt, a Wild Card audience that is gone by Monday, a Super Bowl reactivation with a window of days. Acting on those moments, personally and in real time, is exactly what Positionless Marketing makes possible.
The report shows when bettors act. Positionless Marketing is how a sportsbook acts with them, before, during, and after the game.
The 2025/26 season gave sportsbooks a full record of what bettors said they would do and a complete record of what they did.
That combination provides some intelligence on where to put acquisition budget, how to grow live handle, and what a promotional threshold might be.
This is a reading on last season to help build the next season.
Sportsbooks that use these insights can spend against the audience that shows up, not the one that was expected.
A note on responsible gambling: t_he targeting and reactivation practices discussed here should operate inside each operator's responsible-gambling framework. Bettors displaying markers of harm should be excluded from reactivation and bonus targeting regardless of what the participation data suggests.
About Optimove
Optimove is the creator of Positionless Marketing and the #1 Player Engagement Solution for iGaming and sports betting operators. Positionless Marketing frees marketing teams from the limitations of fixed roles, giving every marketer the power to execute any marketing task instantly and independently. Positionless Marketing has been proven to improve campaign efficiency by 88%, allowing marketing teams to create more personalized engagement with existing customers.
For two years running, Optimove has been positioned as a Visionary in Gartner's Magic Quadrant for Multichannel Marketing Hubs, recognized for its AI-driven decisioning, prescriptive insights, and proven ability to orchestrate thousands of personalized campaigns in real time across channels.
Its Positionless Marketing Platform includes Optimove Engage and Orchestrate for cross-channel campaign decisioning and orchestration; Optimove Personalize, a digital personalization engine; and Optimove Gamify, a loyalty and gamification platform.
All are powered by Optimove AI, the marketing AI suite that brings AI everywhere marketers work. Inside the platform through Native AI agents for decisioning, analysis, and creation, outside it to external AI tools like Claude and ChatGPT through the Optimove MCP, and into custom-built applications on top of the platform through Optimove Custom Apps. Optimove has embedded AI in its platform since 2012, paving the way for Positionless Marketing.
Today, its comprehensive AI-powered suite is at the leading edge of empowering marketers to streamline workflows from Insight to Creation and through Optimization. Optimove provides industry-specific and use-case solutions for leading consumer brands globally.
About Optimove Insights
Optimove Insights is the analytical and research arm of Optimove, dedicated to providing valuable industry insights and data-driven research to empower B2C businesses.
* Note: Figures may not sum to 100 percent because of rounding.
Increasing the Value of New Online Gaming Players
Download the report and discover proven methods to increase new player deposits, retention, and lifetime value when empowered by Positionless Marketing.