Unified Growth Solution
World-class tech needs world-class drivers. AI platform and expert services, unified
Order a free copy of the Positionless Marketing book
Claim your copyRead time 6 minutes
Exclusive Forrester Report on AI in Marketing

One of the main questions that always arise when I meet fellow marketers – maybe it’s not really a question but more of a general wonder - is “how do I know that my campaigns are bringing value to my organization?“ And in the online marketing industry, understanding the incremental revenue generated by campaigns is the eternal conundrum. Wouldn’t you love to know the monetary value generated from a campaign you executed, to make sure your efforts had a measurable impact? But what incremental revenue should be measured? The historic answer has been to select an attribution model (i.e. first-touch, last-touch, multi-touch) for customer acquisition, and use the revenue resulting from that acquisition as a proxy. However, as customers have become more sophisticated and competition has risen steeply, marketers are shifting away from acquisition-focused marketing towards retention-marketing. Today, smart marketers look at revenues generated from existing customers as a stronger measurement for incrementality generated by marketing activities. This shift comes with its own challenges – on how to attribute the specific monetary value generated by a specific customer, to a specific campaign? Over the last few months, I’ve been working hard to crack this riddle. Thanks to Optimove’s clients that focused on creating test vs. control campaigns, I have a solid ground to perform this test and share with you the steps of this research, and some of the conclusions I came up with. This blog is the first in a series of pieces, presenting the different actions and activities a company must take to see real value from its CRM platform.
Optimove followers have heard us pontificating about the importance of the test vs. control method many times before. It’s simple: the optimal measurement starts with treating your campaigns as experiments.
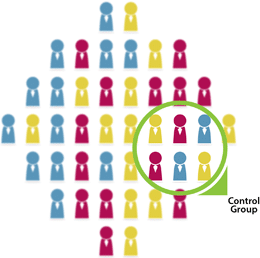
Every time our customers are executing campaigns through a target group, we encourage them to choose the test and control option. We split this group of customers into two groups which differ in only one way – one group (the vast majority) will receive the campaign, and the other will not. This test vs. control method eliminates alternate explanations for the campaign results and thus gives us the best indication of whether the campaign was successful or not.
 Following this track - every Optimove campaign is some kind of an experiment, and we can, therefore, measure the CRM Contribution detected on executed campaigns. Going one step further, we can also aggregate uplift of all executed campaigns at a certain time, which gives us, (in a way, and we’ll go into it) the total CRM contribution.
When examining the CRM Contribution of various Optimove clients, we wanted to find a KPI that can be measured among these clients. There are two important points to consider: The first, in reality, not all of our customers are measuring all their campaigns using the test vs. control practice. Let’s say that you calculated a CRM Contribution of $100K this month but measured only 80% of your campaigns. You have to base the assumption that the uplift generated from 80% of these campaigns also reflects the uplift in the campaigns that lack a control group. In this case, it will affect our calculation as follows: Revenue uplift / %Campaigns with control. Hence - $100K/0.8 = $125K. Also, it won’t be reasonable to compare the uplift that one client had – a client that has an organic yearly revenue of $100M – to one that has only $10M in annual revenue. Therefore, we decided to add another denominator to the calculation: CRM Contribution will be a CRM Contribution percentage, and the final calculation will be: (Revenue uplift / %Campaigns with control) / (Total revenue).
By comparing various clients’ performances, we can see our clients’ CRM Contribution score. In order to have a valid sample of clients, I set thresholds that would exclude clients that might skew the results of our experiment, based on these characteristics:
In this blog, we shared the research made to understand CRM Contribution. We saw the need for CRM Contribution KPI and the components of it. We learned what metrics have an impact on this KPI, and how we can work to increase our CRM Contribution. In our next piece we’ll drill down on the magic numbers derived from our research and try to answer the many questions that undoubtedly arose:
Stay tuned.

Exclusive Forrester Report on AI in Marketing
In this proprietary Forrester report, learn how global marketers use AI and Positionless Marketing to streamline workflows and increase relevance.


Writers in the Optimove Team include marketing, R&D, product, data science, customer success, and technology experts who were instrumental in the creation of Positionless Marketing, a movement enabling marketers to do anything, and be everything.
Optimove’s leaders’ diverse expertise and real-world experience provide expert commentary and insight into proven and leading-edge marketing practices and trends.