Unified Growth Solution
World-class tech needs world-class drivers. AI platform and expert services, unified
Order a free copy of the Positionless Marketing book
Claim your copyRead time 11 minutes
Exclusive Forrester Report on AI in Marketing
Incrementality in marketing is an increase in the desired outcome from marketing activities. It is difficult to determine the impact of individual marketing campaigns on sales and revenue; measuring incremental uplifts allows you to connect uplifts to specific marketing efforts. You can see which ads, channels, and campaigns are contributing to your desired outcomes.
You can measure incrementality by selecting a market segment, making that segment a control group by not exposing them to a marketing campaign, and finding the percentage of that segment that still converts. Subtract that percentage of customers in the control group that converted from the total conversions by the audience that received the marketing campaign to get the incrementality percentage of the campaign.
It is important to measure marketing effectiveness to understand how marketing campaigns affect overall conversions. By measuring marketing success, you can increase effective outputs, optimize your budget, and increase the bottom line. Measuring marketing effectiveness allows you to understand which marketing strategies are increasing revenue while decreasing the cost of acquisition. Overall, measuring marketing impact allows you to determine and use the marketing campaign that has the most effect on your business.
Incrementality testing can provide you with the incremental contribution of a marketing campaign showing the effect of your marketing campaign on your business. You can use an A/B test design to test incrementality. By segmenting your audience into two test groups (Group A and Group B) with similar behavior and then only run marketing campaigns for Group B. When you compare the conversion rates of Group B to Group A (who did not receive any campaigns), the incrementality lift is the increase in conversion from Group A to Group B.
In short, the incrementality figure answers the question: how much additional revenue (or any other KPI) did a campaign actually generate during its measurement period?
This figure indicates the uplift beyond what would likely have happened had the campaign not been run at all, which is calculated by comparing the response of the test and control groups for each campaign during the campaign measurement period. Note that customers in the control group represent the baseline behavior of customers in this target group, meaning their behavior without receiving the campaign in question.
Here’s a quick video to get you going in the right direction (you can also read the transcript here).
https://www.youtube.com/embed/BY0ytNTP4N0
For you to be able to know the exact increase to a given KPI, such as revenue, of any campaign you must use a representative control group. This is due to the fact that incrementality is the difference between the performance of a test group against a control group. It is recommended to use exclusions across your marketing plan to limit the campaign exposure of customers to a single campaign. By using exclusions, you guarantee a cleaner experiment providing better accuracy and reliability of the uplift results.
For example, when using exclusions and having two campaigns: Campaign A and Campaign B, a customer can only be in either A or B. However, when not using exclusions, you actually have 3 customer groups:
Although the above is a simple example, as the number of overlapping campaigns not using exclusions increases, so does the number of possible permutations.
As permutations increase, it is harder to guarantee representative samplings since the target groups will be smaller for each permutation (i.e., there are less customers receiving A & B than receiving only A or B). In other words, as the number of campaigns a customer receives during the measurement period increases, it becomes more difficult to ensure that each “test customer” in each combination has an equivalent “control group customer.” This in turn impacts the validity of the measurement, since for high validity it is necessary that for each “test customer” there is an equivalent “control group customer.”
When conducting campaign analysis, it is best to consider two distinct performance factors:
Many campaigns drive independent, or even opposing, effects on these two factors. For example, a deep discount on a specific offering is likely to increase the number of conversions, while simultaneously reducing the average revenue per transaction. In terms of the factors we’re discussing, such a campaign improves the Response Rate among the test group’s members (compared with members of the control group), but decreases the Average Value.
It is common to calculate the campaign’s uplift in terms of the combined effect of both factors. This is how it works:
For each of the two factors, use the Bayesian Monte Carlo method to calculate the probability that the performance of the test group is better than that of the control group. Probabilities above 90% are considered as an indication that the observed difference in performance between the test and the control groups is indeed due to the campaign, so such a difference should be considered a credible uplift calculation. On the other hand, less conclusive probabilities suggest that the difference in performance might not necessarily be attributed to the campaign – rather, there is a non-negligible chance that the observed difference is “random.” In other words, the difference might have been observed when comparing any two arbitrary groups of customers – so that this difference in performance should not be considered a credible uplift calculation.
A credible positive uplift means that the campaign was effective, successfully influencing customers towards desirable behaviors. Uplifts that are not credible – whether positive or negative – simply mean that there is not enough evidence to make a conclusion either way.
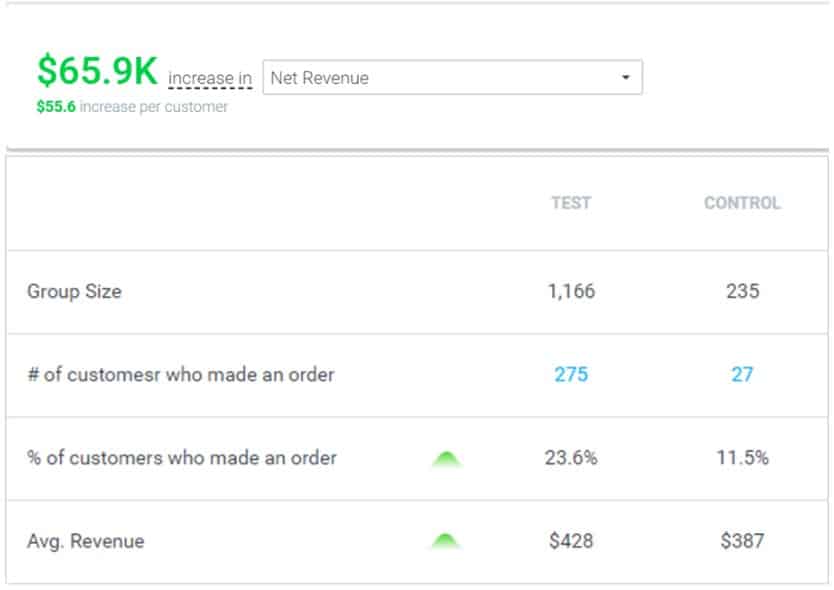
A table like the following, which appears within Optimove’s Campaign Analysis page, presents the campaign performance metrics used to calculate the incrementality figure for the Revenue KPI of a campaign with a test group of 1,166 and a control group of 235. A total target group size of 1,401 customers.
The diagram above outlines an example of how incrementality is calculated.
Incrementality should be interpreted as the additional revenue (or any KPI) obtained as the result of sending the specific campaign to a customer, when compared to a similar customer who was not targeted with that campaign. As a reminder, uplift is not equal to the numerical/absolute value of revenue or any other KPI.
Incrementality is the unique marginal contribution of each specific campaign, making it the only solution to scientifically measuring campaign attribution.
For example, let’s assume you have two campaigns targeting a customer simultaneously. A birthday campaign and a newsletter campaign. At the end of the measurement period, you see that Jane Doe has spent $100 overall.
The question is - how much money of the overall $100 can be attributed to each campaign?
Here’s the answer:
$5 can be attributed to the Birthday campaign, $10 can be attributed to the Newsletter campaign, and the rest can be attributed to spontaneous behaviour irrespective of any campaigns.
Why?
The $5 uplift from the Birthday campaign means that having been targeted with the Birthday campaign made Jane spend $5 more than what she would have spent otherwise, had she not been targeted with the Birthday campaign. This is regardless of any other campaigns she was exposed to (e.g., the Newsletter campaign).
The fact is that there is an equivalent and representative control group for each campaign. As explained by the diagram below, for each customer who received the Birthday campaign and also the Newsletter campaign (labelled “Both”), there is an equivalent customer who did not receive the Birthday campaign but did receive the Newsletter campaign (labelled “Newsletter Only”). This helps balance the effect of the Newsletter campaign on both groups and allows for a clean isolation of the unique and marginal impact of the Birthday campaign. The same is true for the uplift calculated for the Newsletter campaign.
So overall, on average, for a customer such as Jane Doe, $5 can be attributed to the Birthday campaign, $10 can be attributed to the Newsletter campaign, and the remaining $85 she spent (of a total of $100) can be attributed to spontaneous spending behaviour that can be expected by customers who were not targeted with campaign A or B.
Campaign incrementality and revenue, or any other KPI for that matter, are not the same. Revenue is the actual money received from a customer in a given time period. incrementality is a statistical quantity measuring the additional money spent by the customer due to a specific campaign. In other words, it explains the monetary difference resulting from sending or not sending a given campaign to a specific target group.
Since these two metrics are not one and the same, they may be substantially different. For example, uplift may exceed the overall revenue. If a campaign generated a revenue of $1,000, it may be that the overall uplift was $2,000.
Here’s an intuitive example:
In a specific campaign the average net revenue from customers who received the campaign was $100 and the average revenue from customers in the control group was (- $100). The test group deposited $100 on average, while the control group withdrew $100 on average.
In this case the overall absolute revenue is zero (assuming the size and response of customers in the test and control groups are equal).
However, the uplift in this case is $200, since being targeted with the campaign caused customers to spend $100 instead of withdrawing (-$100). In other words, the difference between targeting or not targeting customers in this target group is $200.
To measure marketing effectiveness, you should use several metrics to identify your marketing strategies’ good and bad aspects. By using measurable values, marketers can understand the impact of marketing campaigns across all channels. Some examples of marketing effectiveness metrics include:
Return on marketing investment measures how much revenue a marketing campaign generates compared to the cost of running that campaign. The metric allows you to understand how your campaign is performing and how it contributes to the company’s growth. Marketers strive to use marketing strategies that use an optimal amount of time and money and result in the most company growth.
Website traffic is the total number of people who visit your website during a period. It is a good measure of if your marketing content is working to bring customers to your website. Website traffic can give you a sign of how your website and other content resonates with customers. If your website traffic is high, customers connect with your content and are encouraged to engage with your business.
Customer acquisition cost is how much it costs to gain a new customer. Multiple factors influence customer acquisition costs, including sales and marketing costs. Customer acquisition costs can show which marketing segments are more profitable and responsive. Using this information, you can continue to target profitable segments and engage new segments like customer segments that have been successful.
The customer retention rate is the number of customers a business has kept over time. Customer retention directly affects a company’s revenue and profitability. Therefore, it allows you to understand what marketing campaigns are most effective for retaining more customers.
The subscriber growth rate is the percentage growth of a business’s account base over time. More companies are using blogs, YouTube, and other platforms that allow subscribers. Looking at your subscriber growth rate allows you to determine if your marketing strategies are effective at growing your customer base. Looking at your subscriber growth rate is a good sign of your content and campaign performance because the rate will go up if potential customers enjoy your content and engage with your business.
Optimove allows you to create a control group with each marketing campaign you implement. The platform allows you to measure your marketing campaigns’ lift on your brand’s goals. Optimove calculates a campaign’s uplift in terms of the combined effect of two performance factors: response rate and average value.
Contact us today or request a web demo to learn more about Optimove’s marketing platform.
Exclusive Forrester Report on AI in Marketing
In this proprietary Forrester report, learn how global marketers use AI and Positionless Marketing to streamline workflows and increase relevance.