Unified Growth Solution
World-class tech needs world-class drivers. AI platform and expert services, unified
Order a free copy of the Positionless Marketing book
Claim your copyRead time 3 minutes
Exclusive Forrester Report on AI in Marketing

Let's face it, no matter how convinced you are of control groups' value; you will always want to minimize their size. It's an instinct, plus you probably have an old school manager somewhere using the same tired "control groups leave money on the table" phrase. However, if you use control groups as part of daily or weekly recurring campaigns, manually reducing the sizes is impossible. With Optimove, there is a way to do this automatically. Each new campaign occurrence provides new insights into how that campaign performs, so why not use today's data to determine tomorrow's control group size? As test groups outperform control groups, driving statistically credible higher uplift, the system gradually reduces the campaign's control group size, allowing more customers to receive the campaign. The control group should never hit zero since you always want to be able to measure the campaign's uplift and keep an eye out for changes in these results. On the other hand, if the opposite is true, and a campaign shows signs that it is no longer working, the control group size will increase. Increasing the control group can help understand whether the campaign really isn't working or if it's a false alarm. As a result, you will never again hear the "leaving money on the table" debate. Sounds too good to be true? Let's see what over a year's worth of data tells us.
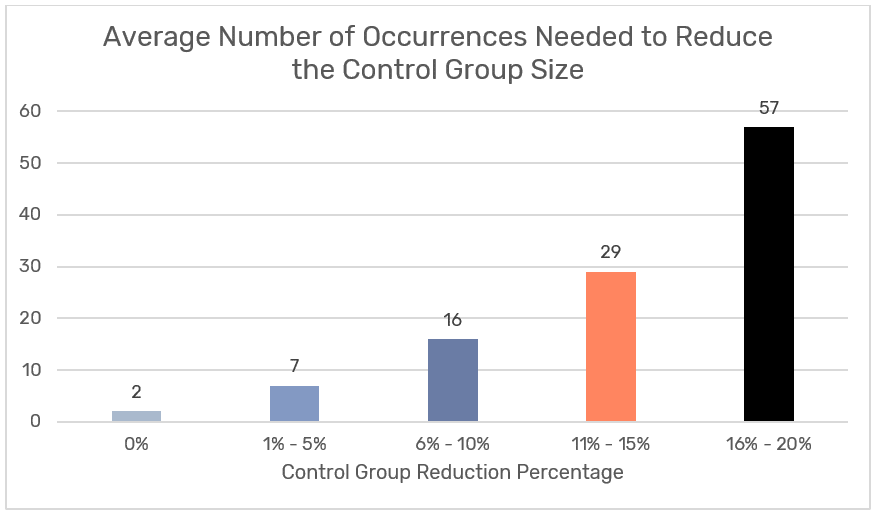
The first thing needed to end this debate is the answer to the question, how long does it take to reduce the control group size? The answer is "very quickly." On average, it takes only three campaign occurrences to begin to see a reduction in control group size and only 57 to reduce the group by between 16% and 20%. That means that you'll find yourself with incredibly small control groups for your daily recurring campaigns in less than two months. While, for example, that weekly newsletter of yours, will start to see changes in the control group size starting its third send.
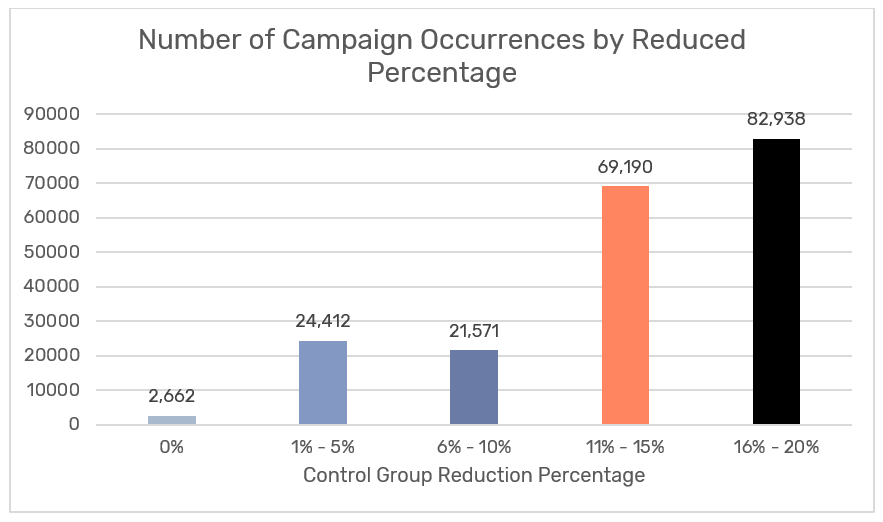
 To put this debate to rest, the next thing you'll want is social proof. A list of all users letting Optimove calculate the ideal control group for each campaign occurrence is too long to print. 198,111, the total number of campaigns, in the past year, which have seen control group reductions, is not.
More impressively, nearly 83 thousand occurrences (41.8%) saw their control group percentage drop by between 16 and 20 percentage points, while only 2,662 didn't see a change.
To put this debate to rest, the next thing you'll want is social proof. A list of all users letting Optimove calculate the ideal control group for each campaign occurrence is too long to print. 198,111, the total number of campaigns, in the past year, which have seen control group reductions, is not.
More impressively, nearly 83 thousand occurrences (41.8%) saw their control group percentage drop by between 16 and 20 percentage points, while only 2,662 didn't see a change.
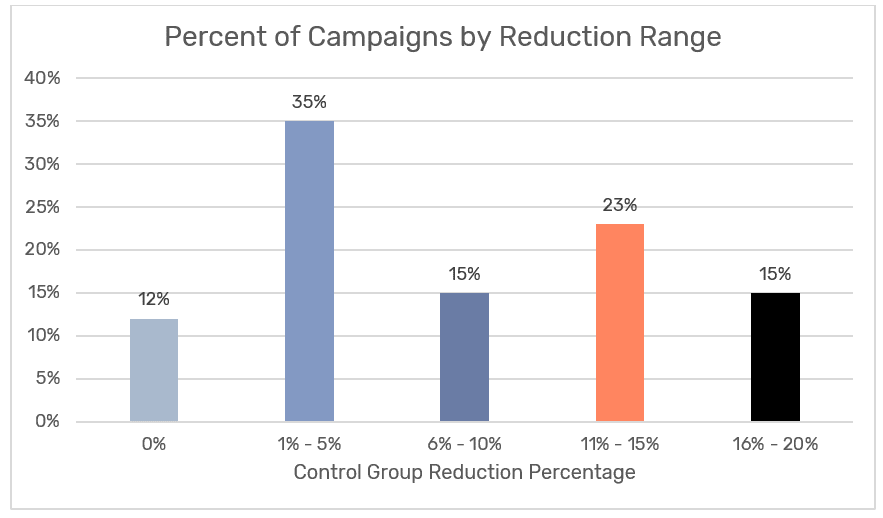
 Finally, you will need to prove what percentage of campaigns, not occurrences (remember: each campaign has multiple occurrences), have significantly reduced their control groups.
Our data shows that over 88% of campaigns have had some reduction. Even better, more than 38% saw double-digit decreases in their control group sizes!
Finally, you will need to prove what percentage of campaigns, not occurrences (remember: each campaign has multiple occurrences), have significantly reduced their control groups.
Our data shows that over 88% of campaigns have had some reduction. Even better, more than 38% saw double-digit decreases in their control group sizes!
 Next time you enter a room, and the control group debate arises, feel free to refer back to this blog to show how algorithms that automatically calculate the control group size make this a moot point.
Exclusive Forrester Report on AI in Marketing
In this proprietary Forrester report, learn how global marketers use AI and Positionless Marketing to streamline workflows and increase relevance.


Rony Vexelman is Optimove’s VP of Marketing. Rony leads Optimove’s marketing strategy across regions and industries.
Previously, Rony was Optimove's Director of Product Marketing leading product releases, customer marketing efforts and analyst relations. Rony holds a BA in Business Administration and Sociology from Tel Aviv University and an MBA from UCLA Anderson School of Management.