Unified Growth Solution
World-class tech needs world-class drivers. AI platform and expert services, unified
Order a free copy of the Positionless Marketing book
Claim your copyRead time 4 minutes
Optimove Pulse. The iGaming Industry Benchmark Tool
Why it matters:
Benchmarking US performance against global norms helps marketers spot where value is being created (higher deposits) and where it’s being lost (retention gaps). These insights help prioritize lifecycle tactics that protect revenue while improving month-to-month engagement.

Key takeaways:
This analysis examines key performance indicators (KPIs) in the online gaming sector, comparing the United States market against the global market. The data is based on a 12-month average of 3.2 million active players per month in the US and 21 million globally. The period analyzed spans from December 2024 to December 2025. The insights cover player growth, deposit amounts, betting volumes, retention rates, and player activity.
Between December 2024 and December 2025, US players consistently deposited significantly more than global players, generally maintaining a gap exceeding $250. The US trend proved fluctuating, with dips in February ($446) and September flanking a mid-year peak in July ($611), before ending the year. In contrast, the Global average was remarkably stable, hovering between $208 and $235 until a distinct uptick in the final quarter.
Both markets recently showed positive momentum. US deposits rose from $529 in November to $544 in December 2025, indicating strong spending power despite lower player counts. The Global market also saw an increase, rising from $230 in November to a yearly high of $259 in December 2025.
What it means for operators: This suggests US operators are capturing stronger wallet share per active player, but the volatility signals a need for lifecycle campaigns that include promotional and gamification elements to drive engagement beyond peak moments and prevent churn after seasonal surges.
Below you can see the Average Monthly Total Deposit Amount per region:
US
Global
See more details in chart below:
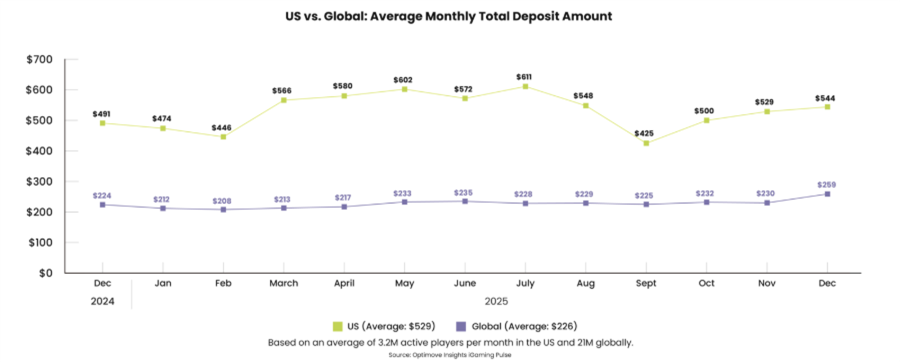
Definition of Average Deposit Amount: The average deposit amount is calculated by taking the total sum of all deposits and dividing it by the number of Sports and Casino bettors (players) who have made at least one deposit.
Global retention has generally been higher than US retention, hovering around 70%. However, the US market has shown resilience; after a significant dip in March (59%), retention rates steadily recovered, eventually nearly converging with the global rate by year’s end.
In the most recent comparison, the US retention rate held steady at 69% in both November and December 2025, indicating the churn rate has stabilized. The Global retention rate decreased slightly, from 73% in November to 70% in December 2025, though it remains slightly higher than the US average.
What it means for operators: The data indicated that while global markets maintain a structural retention advantage, the US is closing the gap, making retention the clearest lever for operators to turn high deposit potential into more loyal, long-term player value.
Below you can see the Average Active Customer Retention Rate per region:
US:
Global:
See more details in chart below:
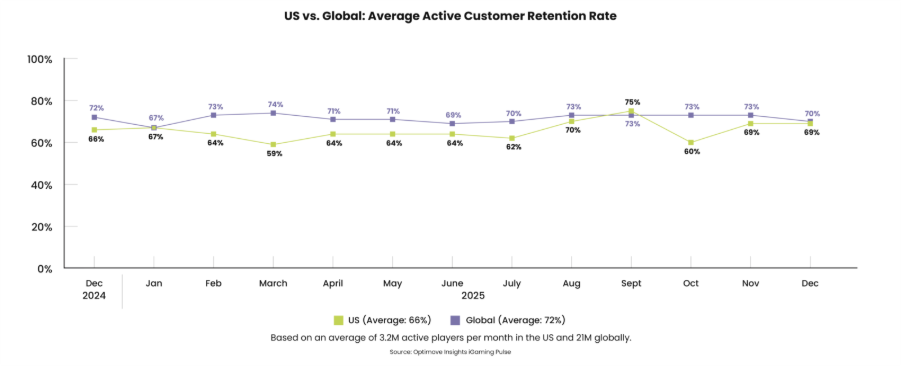
Definition of Active Retention Rate: The percentage of bettors who were active in the preceding month and remained active in the current month.
Protect high-value US spend by building VIP- and mid-tier lifecycle campaigns that respond to deposit volatility (like peak-season boosts, churn-recovery journeys).
Also, retention marketing strategies as the primary lever in the US. Operators can target reactivation within 7 to 14 days after last activity, for example, to keep the recovered 69% rate from slipping.
In global markets, capitalize on Q4 deposit momentum by identifying newly higher-value segments and increasing personalized cross-sell and event-driven offers.
From December 2024 to December 2025, the US market delivered materially higher average deposits than the global benchmark, while global retention remained slightly stronger overall. By the end of 2025, both markets showed positive momentum, with US deposits finishing higher and US retention stabilizing close to global levels.
For a closer look at the data behind these trends, visit Optimove’s iGaming Pulse Report.
For more insights into player behavior, contact us to request a demo.
iGaming Pulse: The daily benchmark for iGaming Operators


Roni is a Marketing Research Analyst on Optimove’s Professional Services team.
As part of her role, she analyzes customer data to extract actionable marketing insights for retail and gaming clients. Roni is currently pursuing a degree in Industrial Engineering and Management at Tel Aviv University.