Unified Growth Solution
World-class tech needs world-class drivers. AI platform and expert services, unified
Order a free copy of the Positionless Marketing book
Claim your copyRead time 4 minutes
Exclusive Forrester Report on AI in Marketing
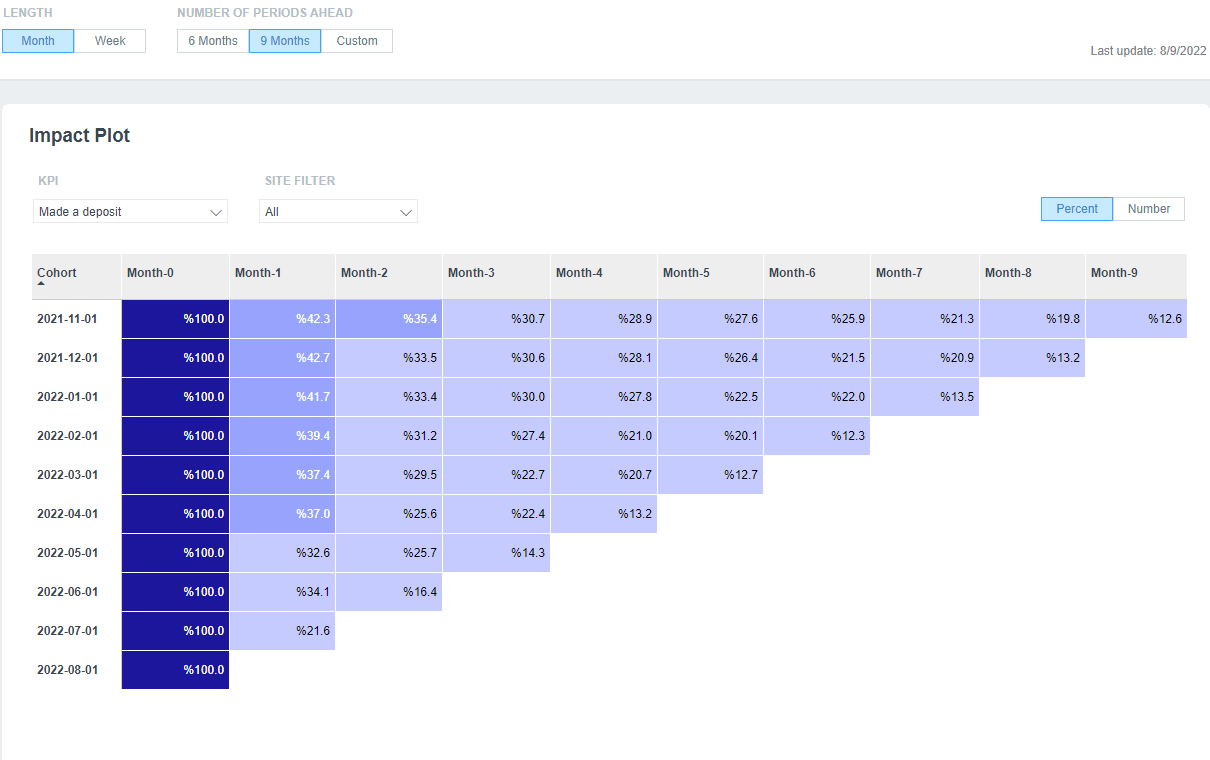
Cohort analysis is the analysis of the behavior of a particular group of customers over time. Cohorts are unchanging groups, e.g., no new customers join a cohort once formed, and customers cannot move from one cohort to another. The most common type of cohort is the group of people who became customers in a particular time frame, e.g., the second week of the month of January, or the fourth quarter of the year. Also known as “static pool analysis,” cohort analysis looks at how these specific, fixed customer groups behave over time and how they move along the curve of the customer lifecycle.
Cohort analysis is useful to identify trends within customer behavior that may be hidden when looking at more general analytics data. For example, overall analytics data may indicate an increasing number of monthly purchases, a very positive sign for the business. However, cohort analysis can reveal that, in fact, the higher overall percentage is due to many first-time buyers, while cohorts of older customers are actually returning to make purchases much less frequently than in the past. Thus, by following the behavior of particular cohorts over time, a more accurate view of business performance is possible.
Likewise, when the company experiences a “bad month,” it is critical to understand if the unexpected performance drop was due to a market-wide factor (e.g., a quiet summer month) or to a specific problem that might be identified and adjusted. For example, if it is discovered that most new customers in a particular month spent much less than the customers acquired in previous months, it would be wise to examine any changes in acquisition strategy (e.g., traffic sources) and identify under-performers.
As was illustrated in the above examples, most cohort analysis performed today looks at groups of people who became customers in a particular time period. The specification and tracking of more sophisticated cohorts, however, can lead to far deeper insight into customer behavior trends.
A more advanced use of cohort analysis is tracking the longer-term impact of a particular marketing action on the group of customers who were treated with that marketing action. Take, for example, a group of 5,000 customers who received a 20% discount coupon code by email. A sophisticated marketer will want to track the behavior of these 5,000 over 3-6 months, instead of just measuring the immediate response rate to the offer. By creating a cohort of this customer group and tracking its behavior (spending patterns, churn rate, etc.) over time, the marketer can achieve much deeper insight into the long-term effects of a particular marketing action.
Another advanced use of cohort analysis is combining cohort analysis with behavior-based customer micro-segmentation. A gaming website, for example, might define a cohort of VIPs (high spenders) who spent more than 75% of their money on Bingo over the past six months and who joined the site in January. Spotting trends among very specific groups of customers often yields insights of tremendous value to customer acquisition, uplift marketing and customer retention.
Survival rates help marketers understand the percentage of users who remain customers over time. You can use cohort analysis to compare the survival rates of multiple cohorts to understand which segments are performing better. Comparing the survival rates of cohorts allows marketers to determine the best action to retain more customers and engage different market segments.
Optimove combines cohort analysis with multi-dimensional behavioral-based dynamic customer segmentation to achieve highly sophisticated customer tracking and customer analytics. The resulting customer insight and marketing action optimization can revolutionize the way marketers and retention experts ply their craft.
Contact us today – or request a Web demo – to learn how you can use Optimove to perform advanced cohort analysis and easily maximize the impact of every marketing action in order to convert more customers, increase the spend of existing customers and reduce customer churn.
Exclusive Forrester Report on AI in Marketing
In this proprietary Forrester report, learn how global marketers use AI and Positionless Marketing to streamline workflows and increase relevance.