Unified Growth Solution
World-class tech needs world-class drivers. AI platform and expert services, unified
Order a free copy of the Positionless Marketing book
Claim your copyRead time 4 minutes
Exclusive Forrester Report on AI in Marketing

Customer lifetime value is a key metric that every marketer should track, as it usually reflects the core health of customer-centric businesses.
There are various formulas floating around the Web aimed at helping marketers quickly calculate customer lifetime value. Using these straightforward equations may be appealing, but when components of the formula are based on averages (as they must be), the results are usually quite crude.
Instead, you might want to use the following simple method. This approach uses Excel, but it does not require any complex formulas or macros. It’s not as accurate as building a customer model based on predictive micro-segmentation (which is the basis of Optimove’s retention automation software), but it is faster, more cost-effective and more accurate than many other alternatives.
Start by taking a cohort of new customers and follow their cumulative spending over time. This approach gives you an accurate basis, both because cohorts are closed groups of actual customers, and because cohorts already include all the parameters that you would otherwise have to insert into your formulas (for example, churn is built in because the cohort’s value drops from period to period due to customer churn).
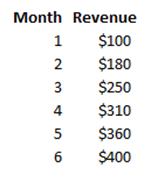
Tally the cohort’s total cumulative revenues (or any other value metric you choose) in Excel for each period, starting with their first period. Divide this figure by the number of customers in the cohort to get an average per-customer figure. In this example, I am looking at the cumulative revenue generated by an average customer within one particular cohort during their first six months:
Create a simple Excel line chart for this data (instructions here).
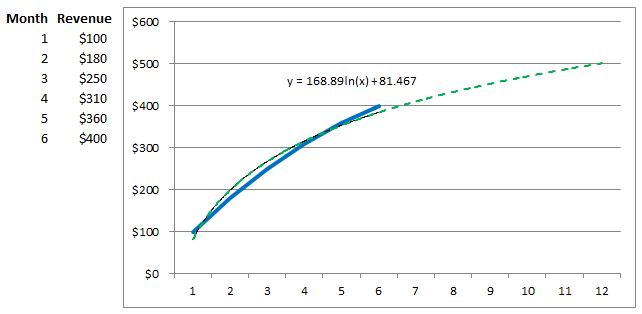
Next, use Excel’s built-in Trendline function to discover the logarithmic formula that best fits the cohort’s value trend over time. You can then use that formula to predict the value of this cohort’s average customer into the future. (The reason I suggest using a logarithmic trendline is because it is usually the best fit for any pattern that exhibits diminishing periodic increases over time, which is usually the case when looking at the cumulative value of any given customer cohort.)
Here is an example, where I’ve plotted the six months of cumulative spending data above for an average customer within our cohort, and then generated a predictive trendline, an additional six periods into the future:
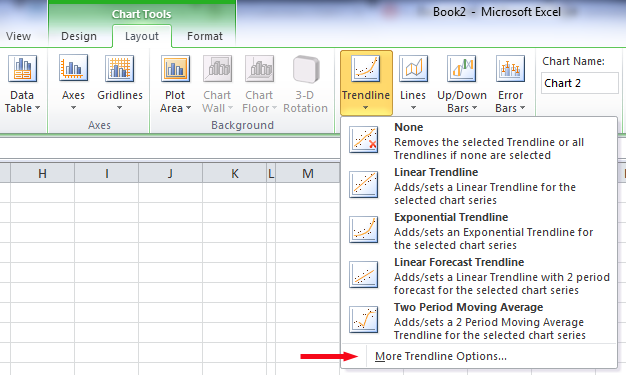
To get this type of graph in Excel, and reveal the logarithmic formula as shown, add a trendline to your line chart, by clicking Trendline and then More Trendline Options:
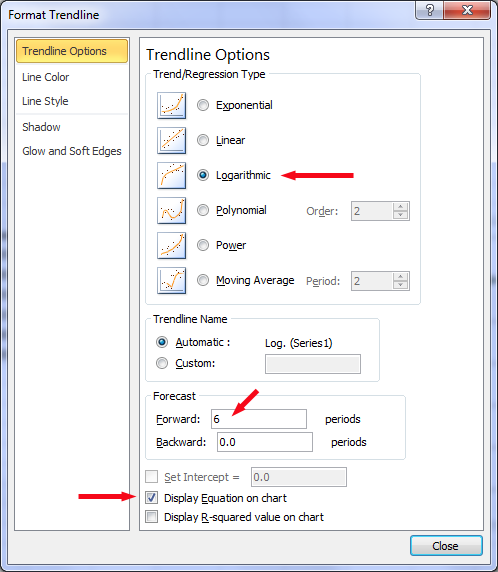
Select Logarithmic, enter the number periods you want to see in your forecast, and select the Display Equation checkbox:
You can now use the logarithmic formula determined by Excel to tally CLV as far into the future as you consider reasonable.
If you’re looking for more advanced customer data analysis, and automated targeting and personalization of customer marketing campaigns, check out our Optimove’s Science-First Relationship Marketing Hub.
Exclusive Forrester Report on AI in Marketing
In this proprietary Forrester report, learn how global marketers use AI and Positionless Marketing to streamline workflows and increase relevance.


Pini co-founded Optimove in 2012 and has led the company, as its CEO, since its inception. With two decades of experience in analytics-driven customer marketing, business consulting and sales, he is the driving force behind Optimove. His passion for innovative and empowering technologies is what keeps Optimove ahead of the curve. He holds an MSc in Industrial Engineering and Management from Tel Aviv University.