Unified Growth Solution
World-class tech needs world-class drivers. AI platform and expert services, unified
Order a free copy of the Positionless Marketing book
Claim your copyRead time 26 minutes
Executive Summary:
According to Forrester’s 2022 Global Marketing Survey, 45% of B2C marketers cited personalizing communications, experiences, and interactions as the greatest challenge with marketing execution.1 Meanwhile, personal data collection and activation have also become increasingly challenging. Under these circumstances, marketers are looking for tools that can improve their data access and campaign orchestration to drive business performance.
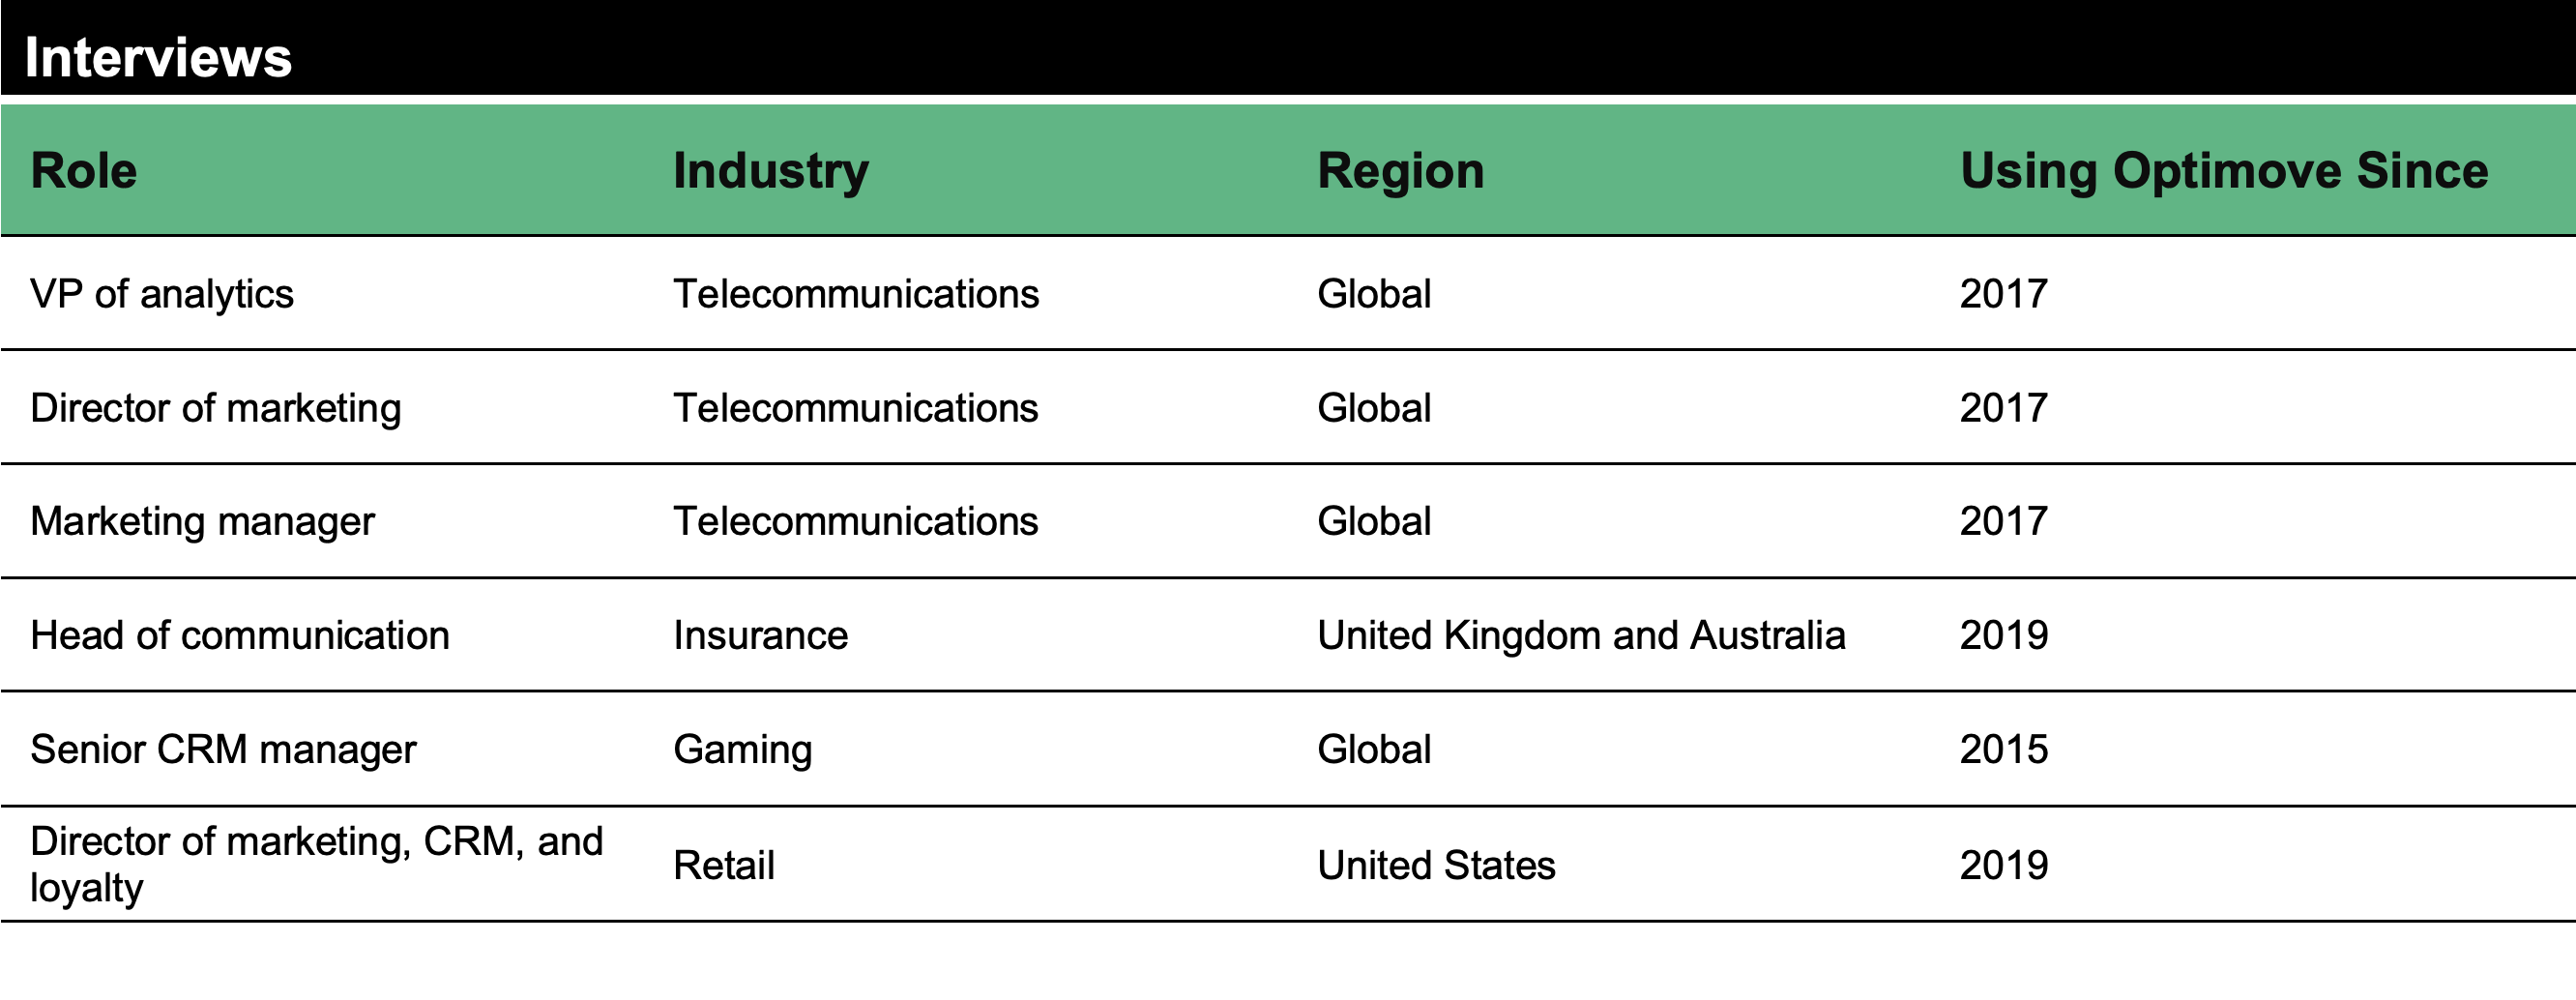
Optimove provides a customer-led marketing platform that empowers marketers to drive measurable growth by planning, orchestrating, and optimizing marketing programs that start with the customer instead of a campaign or product. Optimove commissioned Forrester Consulting to conduct a Total Economic Impact™ (TEI) study and examine the potential return on investment (ROI) enterprises may realize by deploying Optimove. 2 The purpose of this study is to provide readers with a framework to evaluate the potential financial impact of Optimove on their organizations. To better understand the benefits, costs, and risks associated with this investment, Forrester interviewed six representatives at four organizations with experience using Optimove. For the purposes of this study, Forrester aggregated the interviewees’ experiences and combined the results into a single composite organization that is a B2C firm with 500,000 customers and revenue of $150 million per year.
Prior to using Optimove, interviewees noted how their organizations struggled to support increasing business volume with existing manual marketing tools. They could only send out bulk emails without much personalization. Once campaigns were launched, they also didn’t have the capability to aggregate and analyze customer data to generate business insights. These limitations prevented marketing organizations from measuring and improving marketing performances.
After the investment in Optimove, the interviewees orchestrated campaigns across multiple channels; automated and personalized campaigns easily; and analyzed campaign results and customer data to improve marketing outcomes.
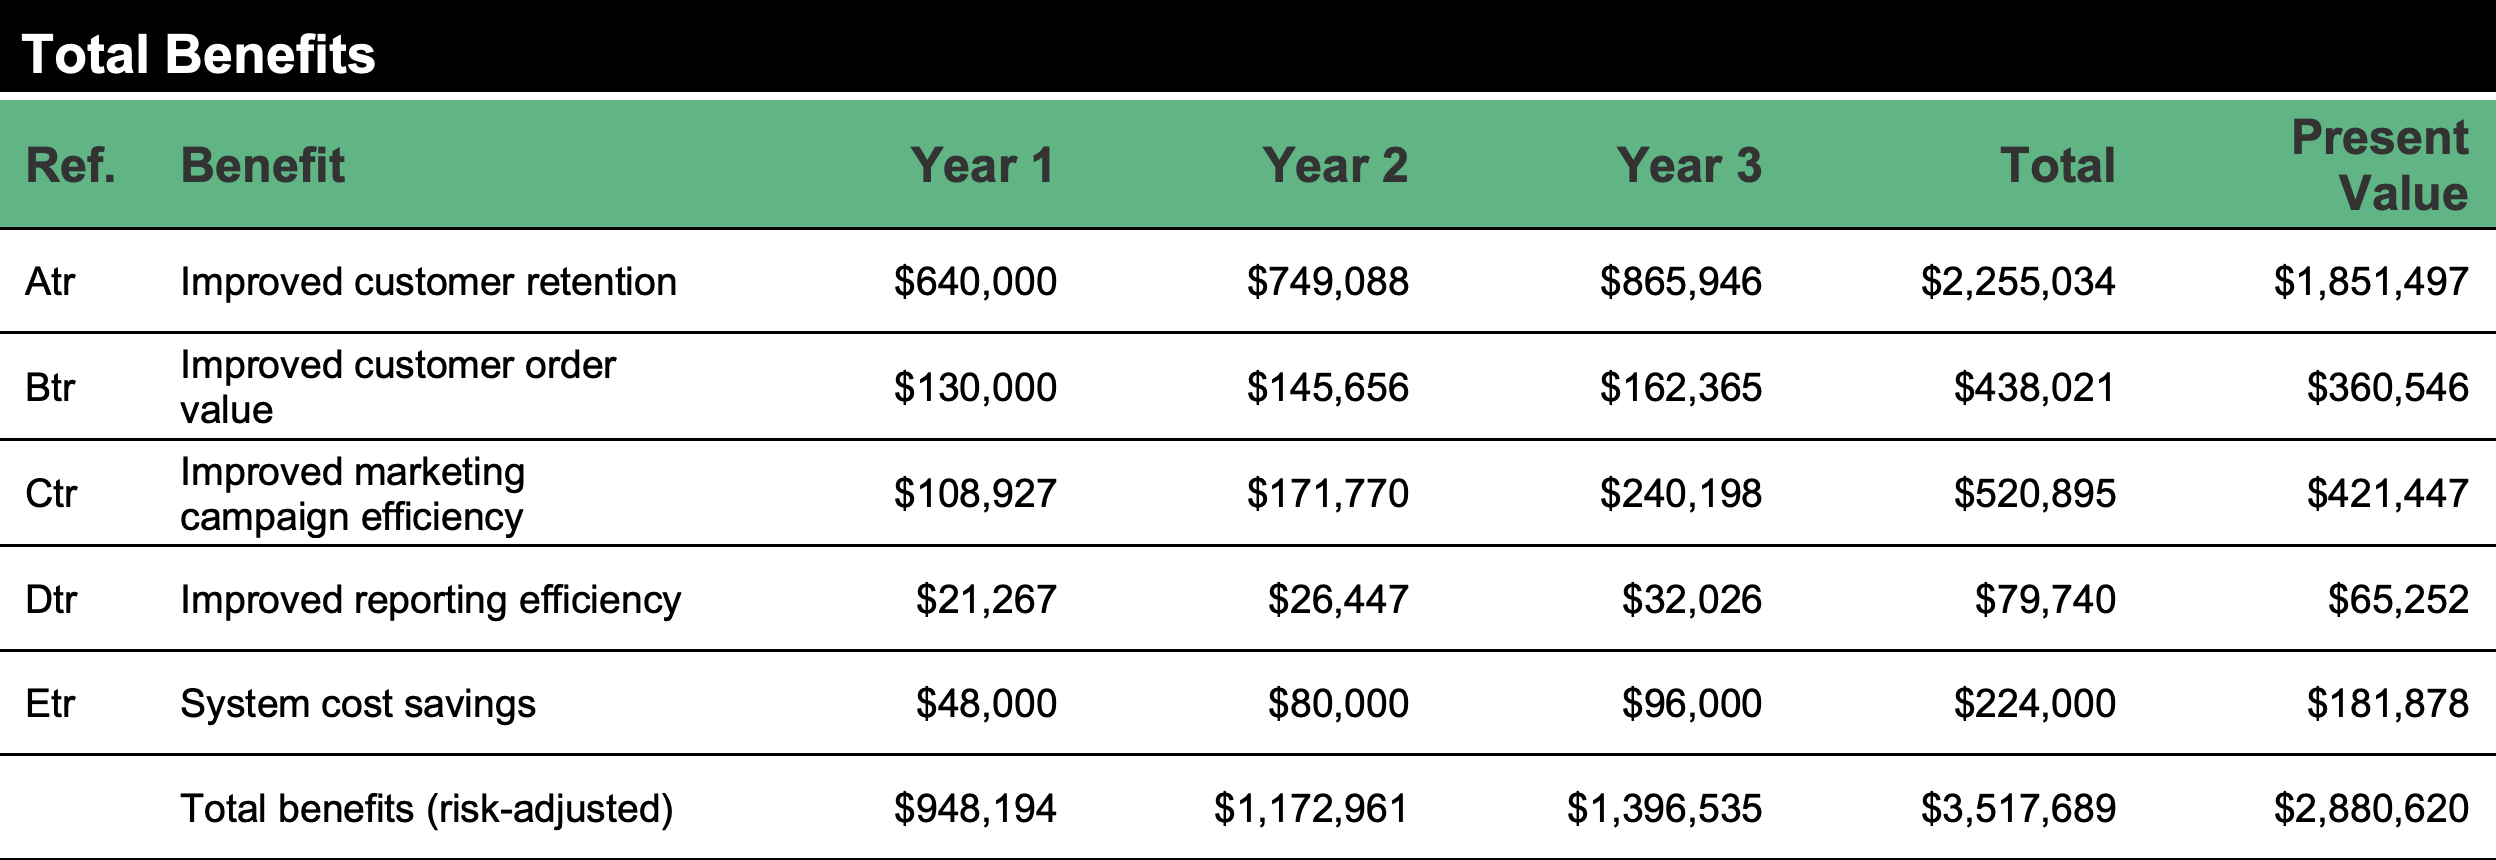
Three-year, risk-adjusted present value (PV) quantified benefits for the composite organization include:

Benefits that provide value for the composite organization but are not quantified in this study include:
Three-year, risk-adjusted PV costs for the composite organization include:
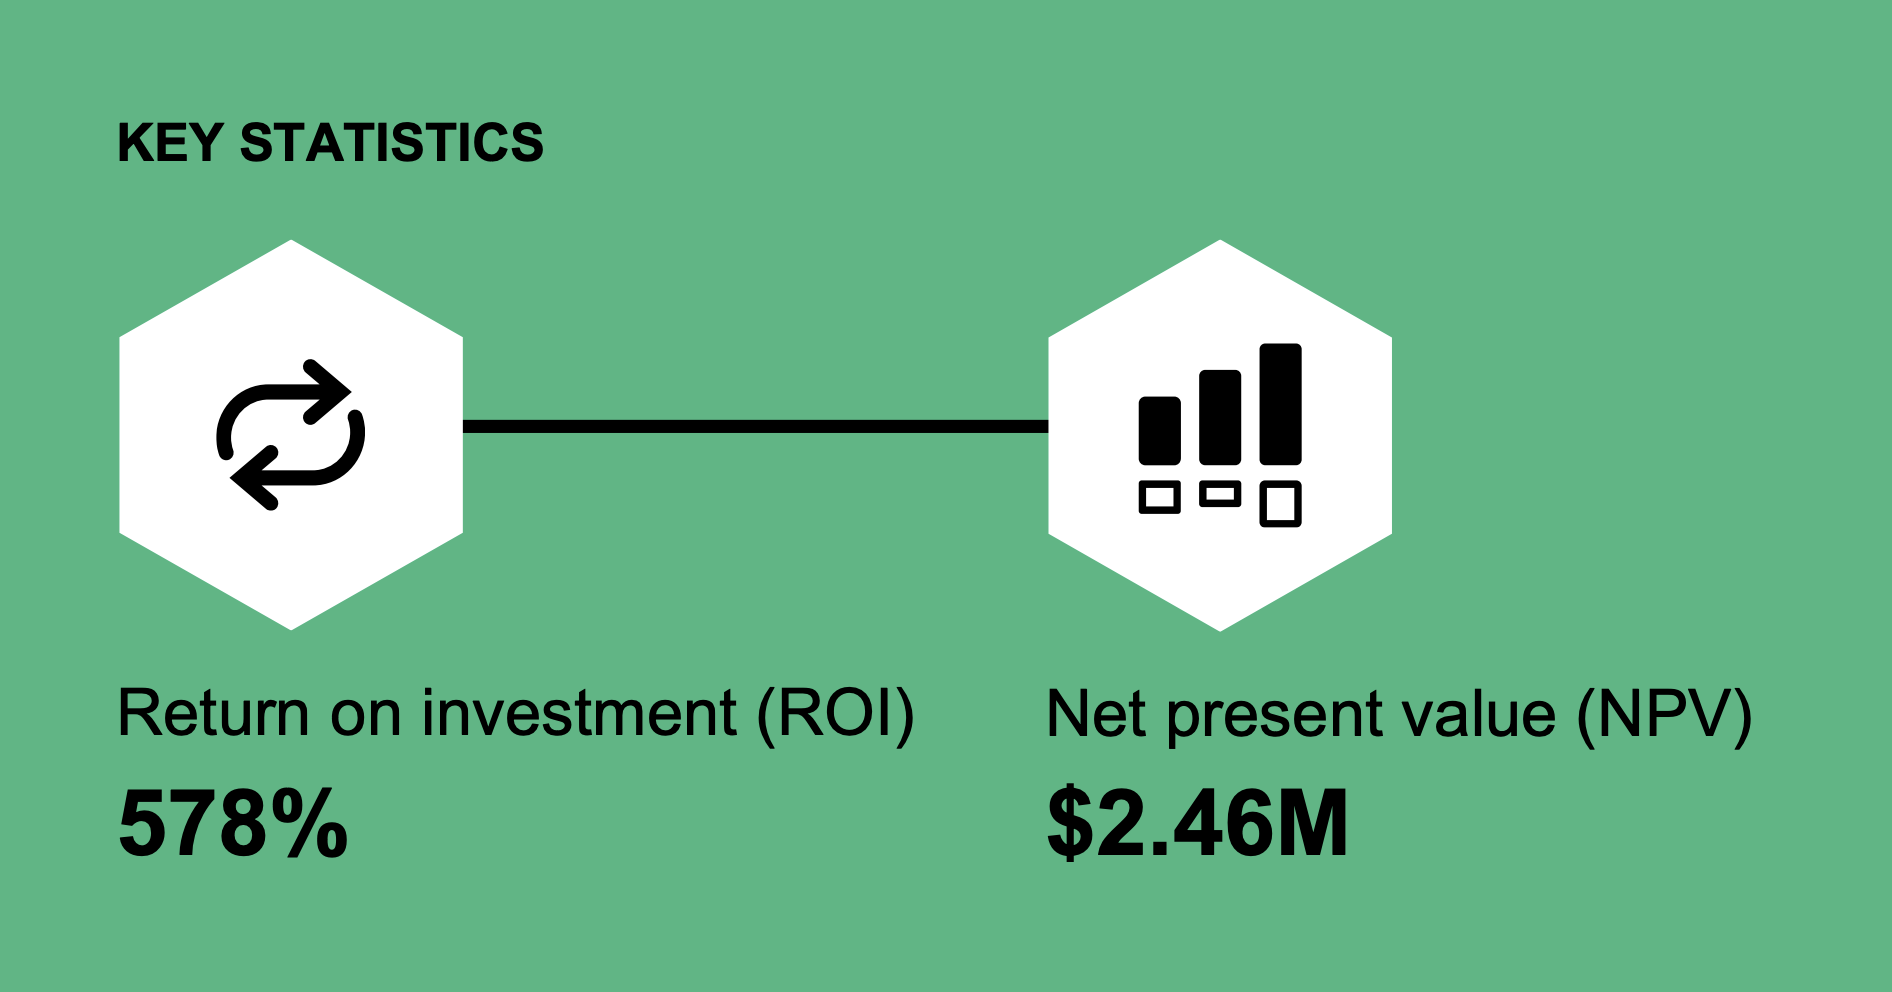
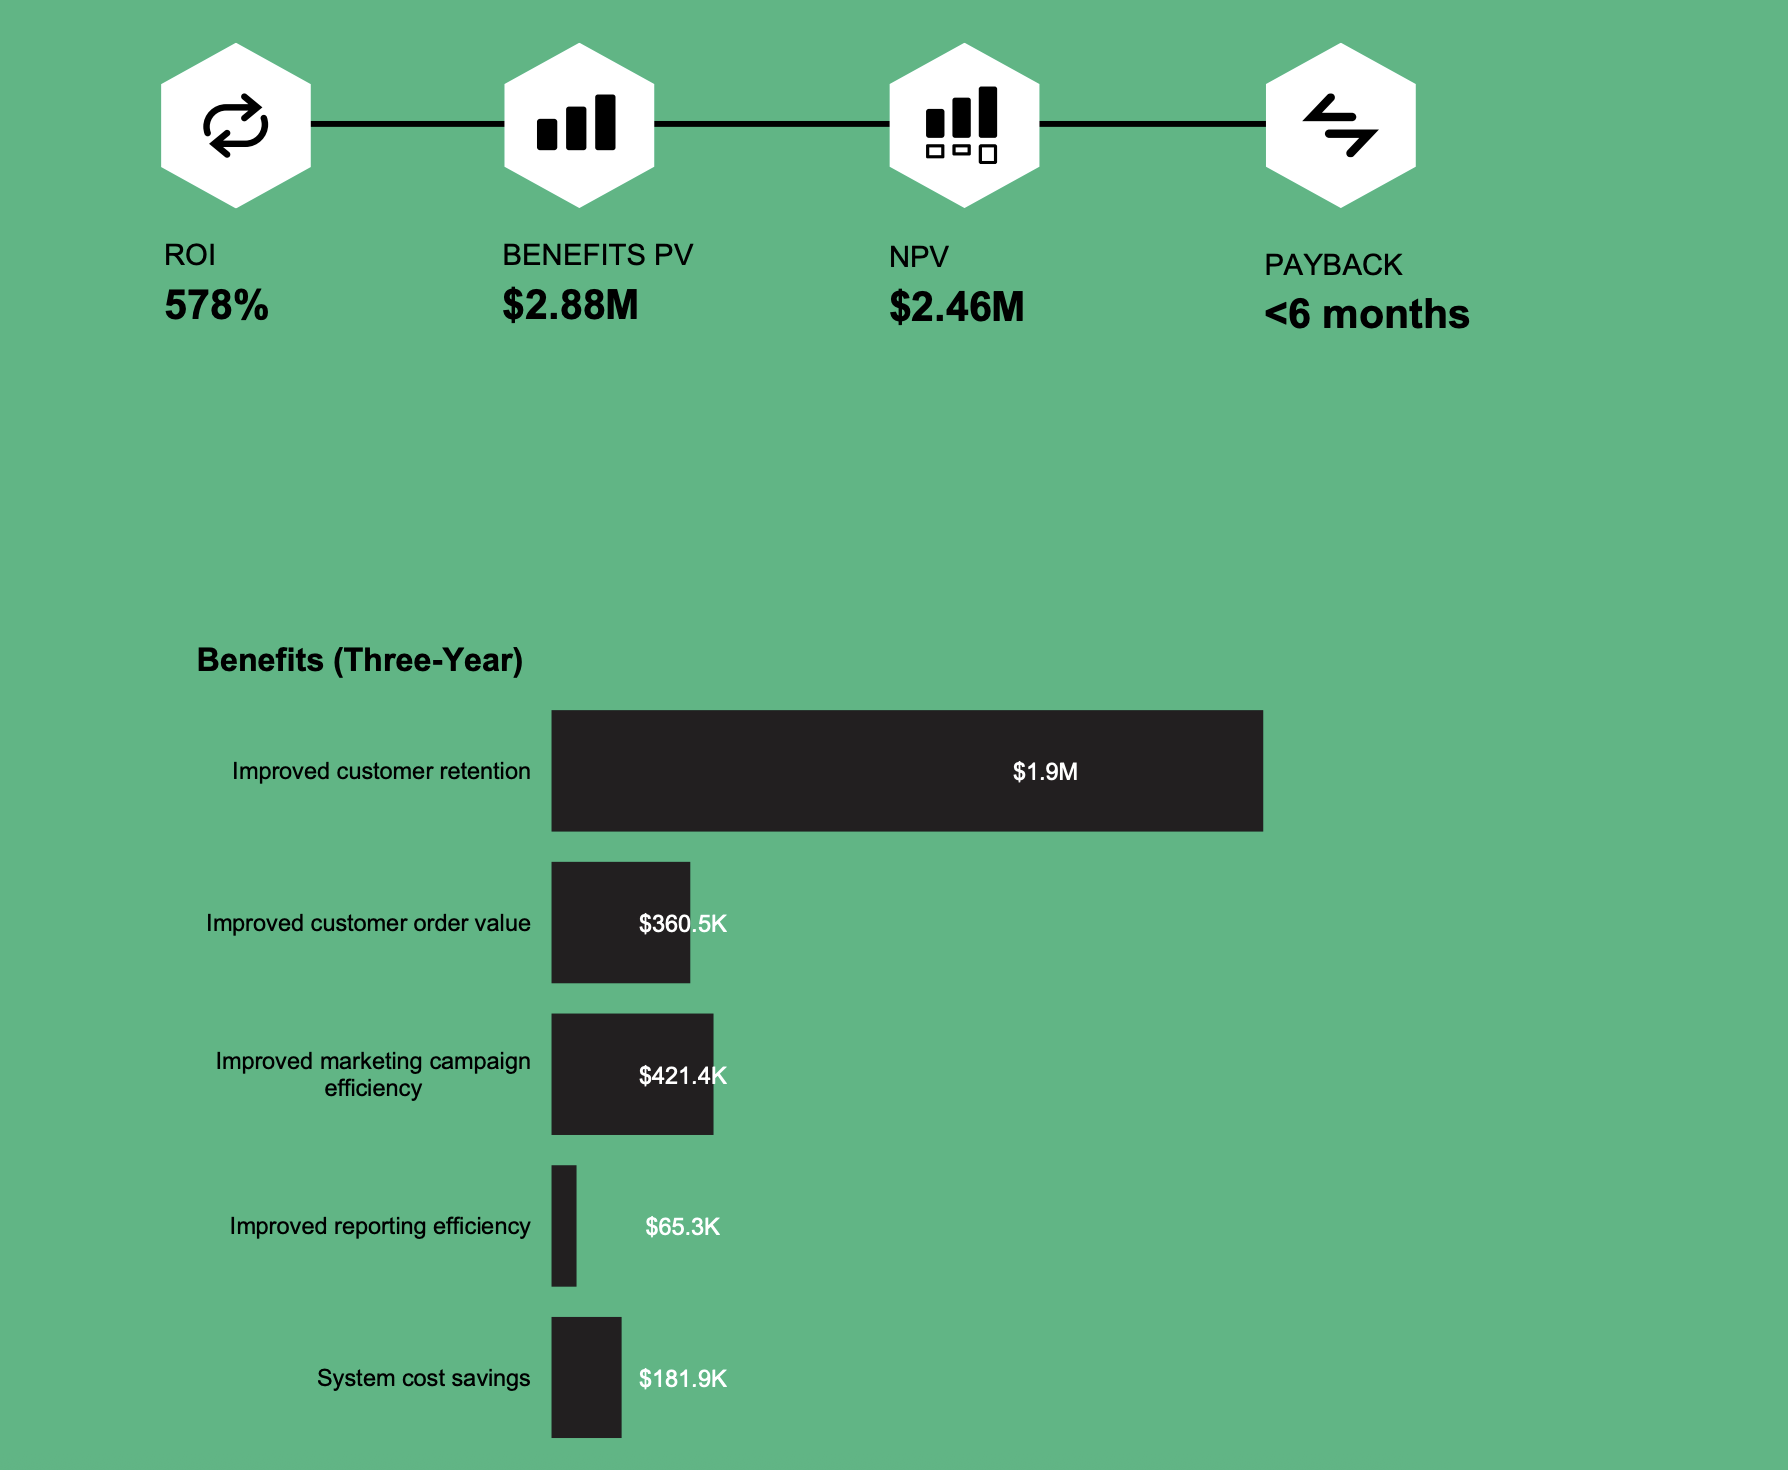
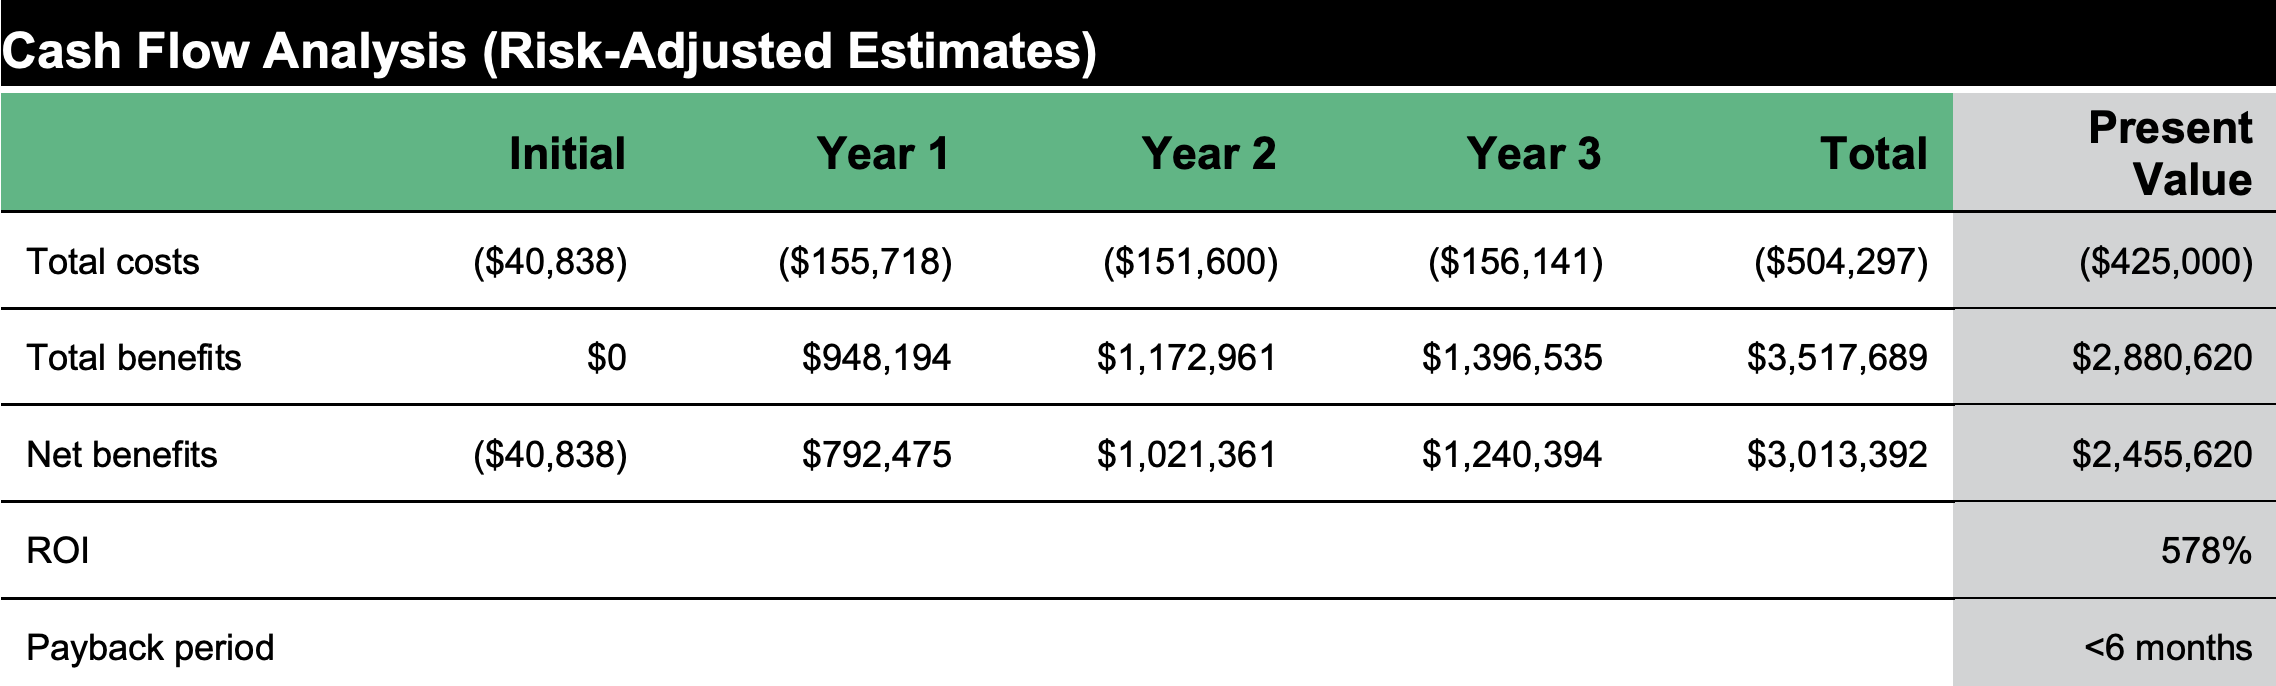
The representative interviews and financial analysis found that a composite organization experiences benefits of $2.88 million over three years versus costs of $425,000, adding up to a net present value (NPV) of $2.46 million and an ROI of 578%.
“Optimove is invaluable in how it gives us the ability to see and figure out where something is wrong and how to fix it. Our previous tools did not come close to that.”
— Senior CRM manager, gaming
From the information provided in the interviews, Forrester constructed a Total Economic Impact™ framework for those organizations considering an investment in Optimove. The objective of the framework is to identify the cost, benefit, flexibility, and risk factors that affect the investment decision. Forrester took a multistep approach to evaluate the impact that Optimove can have on an organization.
Interviewed Optimove stakeholders and Forrester analysts to gather data relative to Optimove.
Interviewed six representatives at four organizations using Optimove to obtain data with respect to costs, benefits, and risks.
Designed a composite organization based on characteristics of the interviewees’ organizations.
Constructed a financial model representative of the interviews using the TEI methodology and risk-adjusted the financial model based on issues and concerns of the interviewees.
Employed four fundamental elements of TEI in modeling the investment impact: benefits, costs, flexibility, and risks. Given the increasing sophistication of ROI analyses related to IT investments, Forrester’s TEI methodology provides a complete picture of the total economic impact of purchase decisions. Please see Appendix A for additional information on the TEI methodology.
DISCLOSURES
Readers should be aware of the following: This study is commissioned by Optimove and delivered by Forrester Consulting. It is not meant to be used as a competitive analysis. Forrester makes no assumptions as to the potential ROI that other organizations will receive. Forrester strongly advises that readers use their own estimates within the framework provided in the study to determine the appropriateness of an investment in Optimove. Optimove reviewed and provided feedback to Forrester, but Forrester maintains editorial control over the study and its findings and does not accept changes to the study that contradict Forrester’s findings or obscure the meaning of the study. Optimove provided the customer names for the interviews but did not participate in the interviews.
Prior to their investment into Optimove, the interviewees struggled to create a holistic view of their customers. Interviewees faced several common challenges, including:
“Not only has it allowed us to get better results, but it also expanded the amount of customer communications we’re able to do.”
Director of marketing, telecommunications
Due to the challenges above, interviewees’ organizations searched for a solution that could provide:
Based on the interviews, Forrester constructed a TEI framework, a composite company, and an ROI analysis that illustrates the areas that are financially affected. The composite organization is representative of the six interviewees from four organizations, and it is used to present the aggregate financial analysis in the next section. The composite organization has the following characteristics:
Description of composite. The composite organization is a B2C firm operating in Europe and North America. The organization has an annual revenue totaling $150 million with more than 300 employees.
Deployment characteristics. In Year 1 of adoption, the number of reachable customers is around 500,000 with an average customer order value of $200. There are five employees in the marketing team using Optimove. Outside of marketing, there are another five employees using Optimove dashboards for analytics and decisioning purposes. The composite organization uses the Optimove platform and several add-ons, including OptiMail; Facebook and Google integration; and in-app push notifications. To improve marketing journey and analytics capabilities with Optimove, the organization also purchases 500 professional services hours per year.
Key Assumptions
Evidence and data. Marketing and advertising are on a wild ride thanks to four major forces:
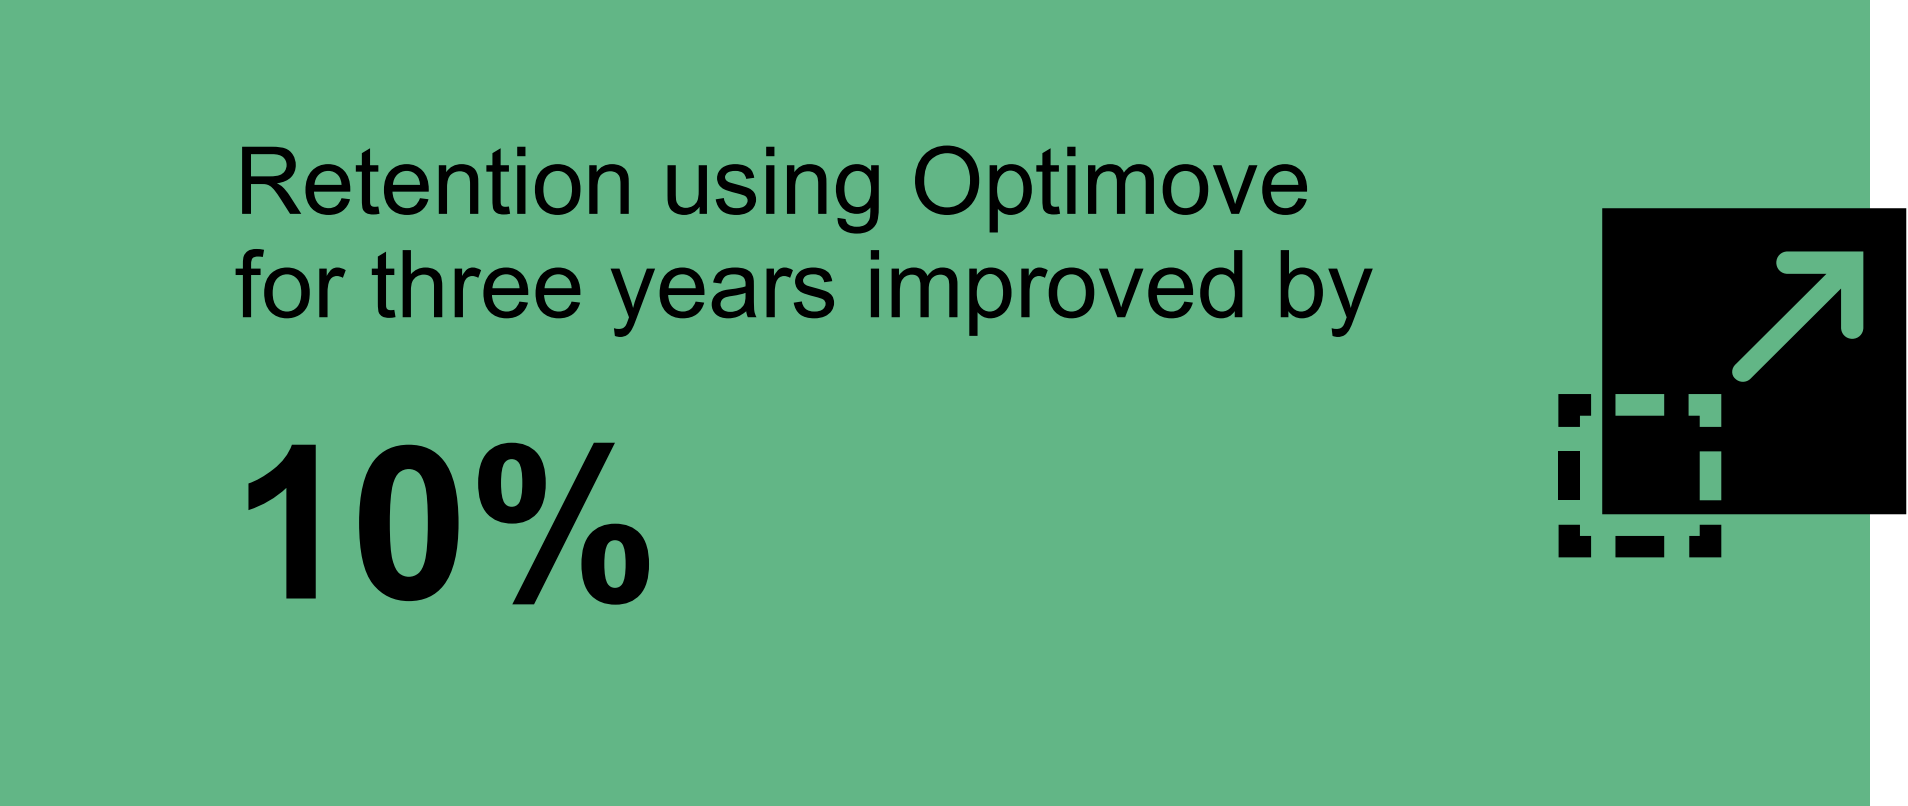
These forces — which Forrester collectively calls data deprecation — make it difficult for marketers and advertisers to collect and activate consumer data at scale, and the situation will only get more pronounced over the next year. Given these circumstances, more consumer-facing brands have been gradually redistributing their marketing budget from new customer acquisition to customer retention. Interviewees of this study all acknowledged the importance of Optimove in improving their customer retention.
Modeling and assumptions. For the analysis, Forrester assumes the following about the composite organization:
“Optimove has helped us shift our business away from relying heavily on customer acquisition and paying to be in the space of paid social, paid search display, and affiliate marketing.”
Director of marketing, CRM, and loyalty, retail
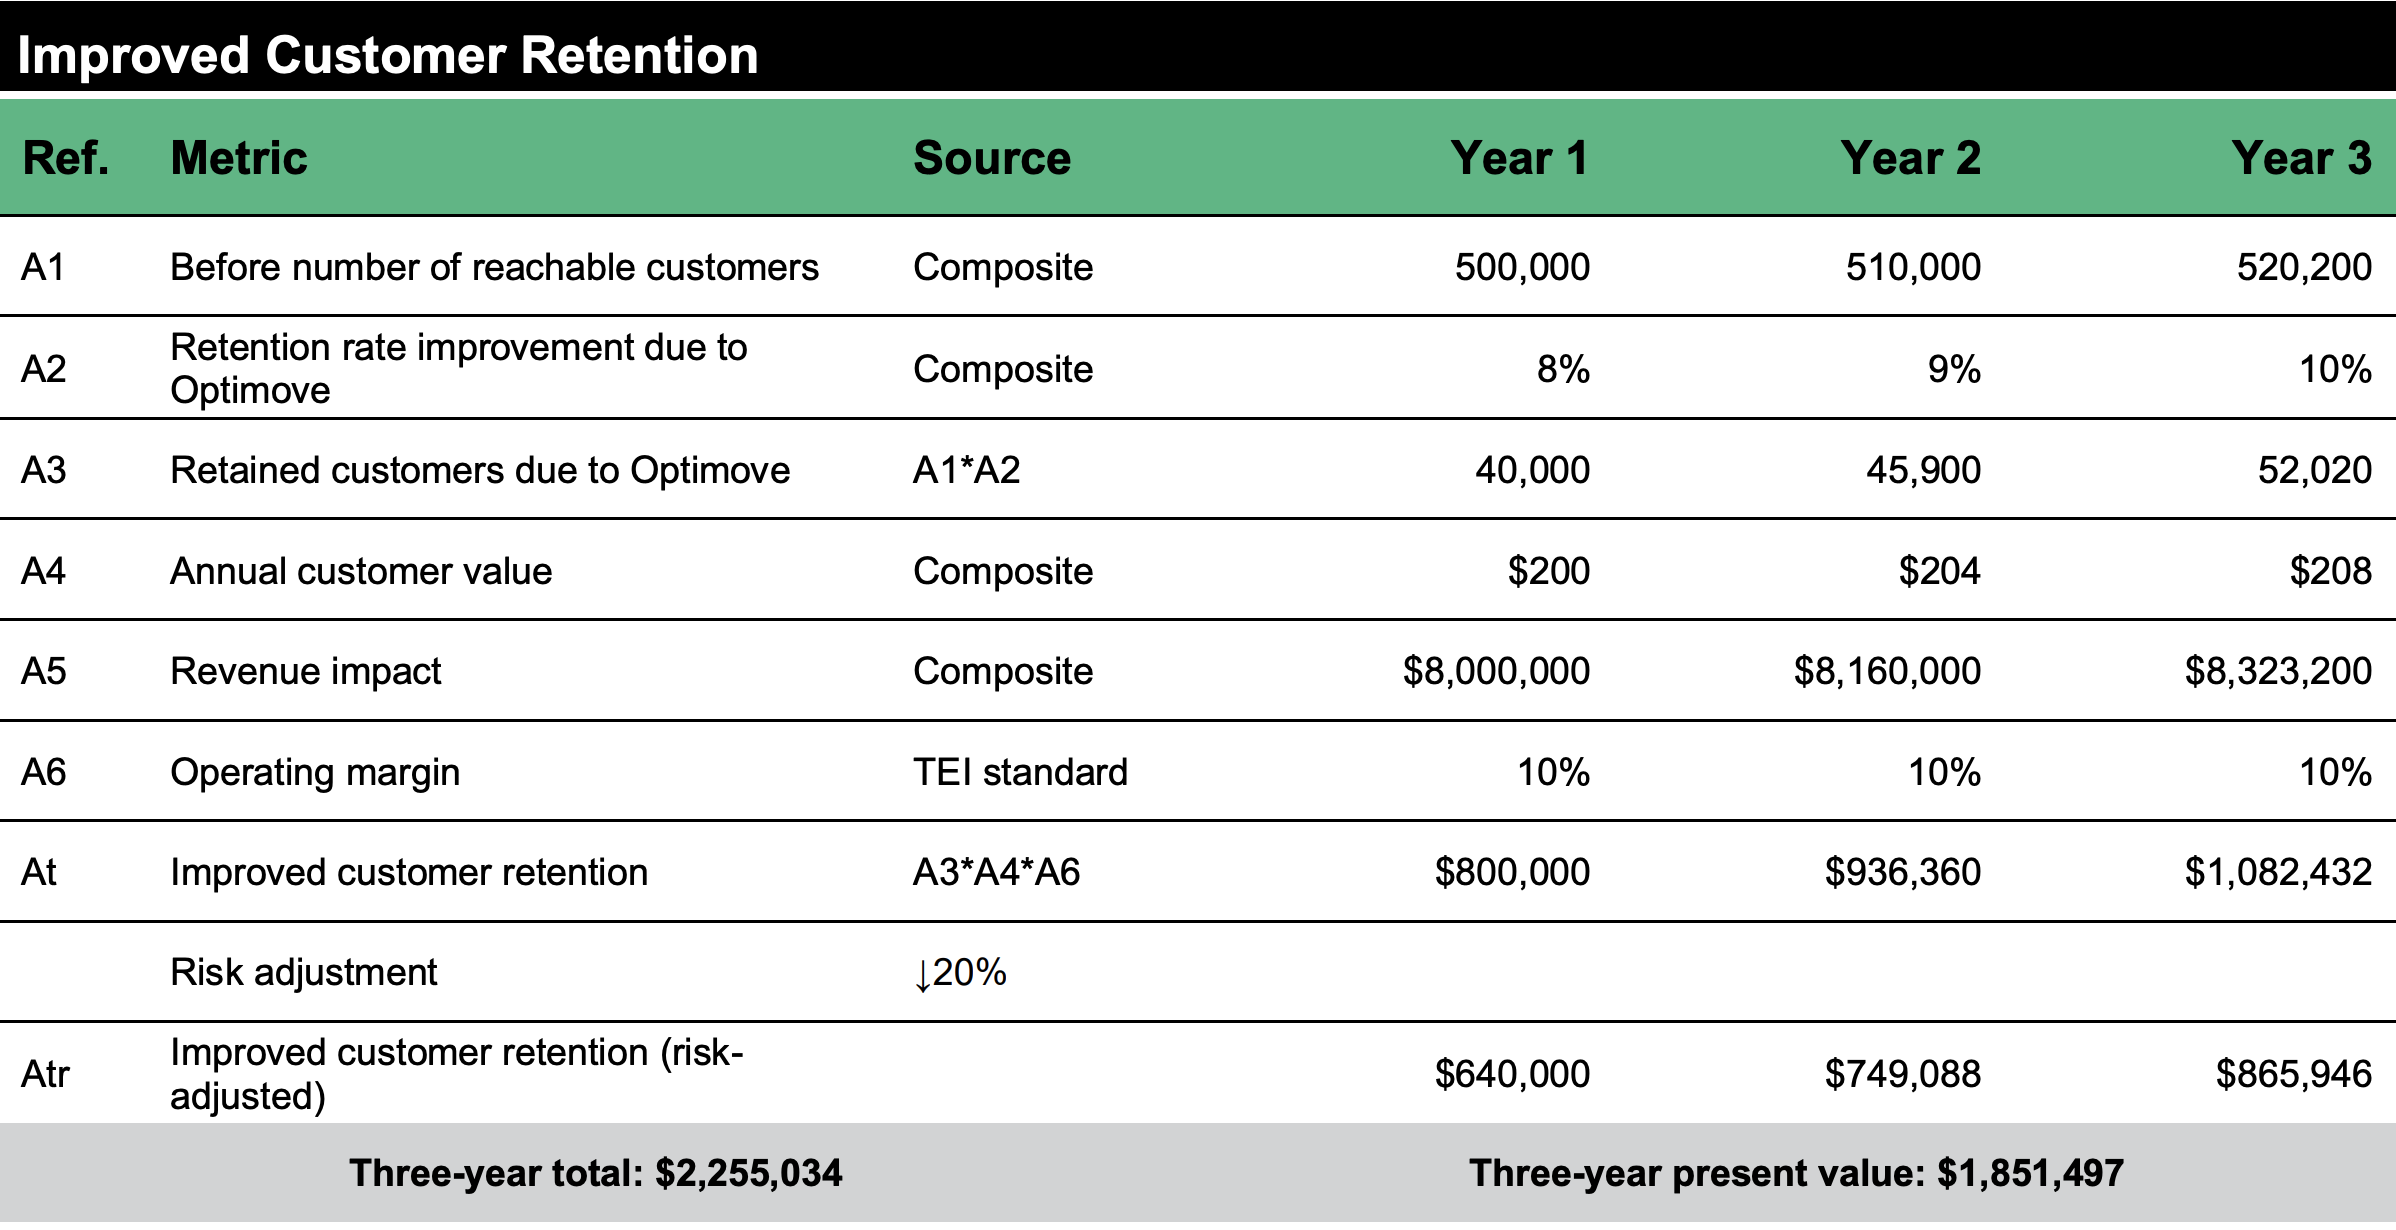
Risks. Several factors could impact the outcome of this benefit, including:
Results. To account for these risks, Forrester adjusted this benefit downward by 20%, yielding a three-year, risk-adjusted total PV (discounted at 10%) of $1.9 million.
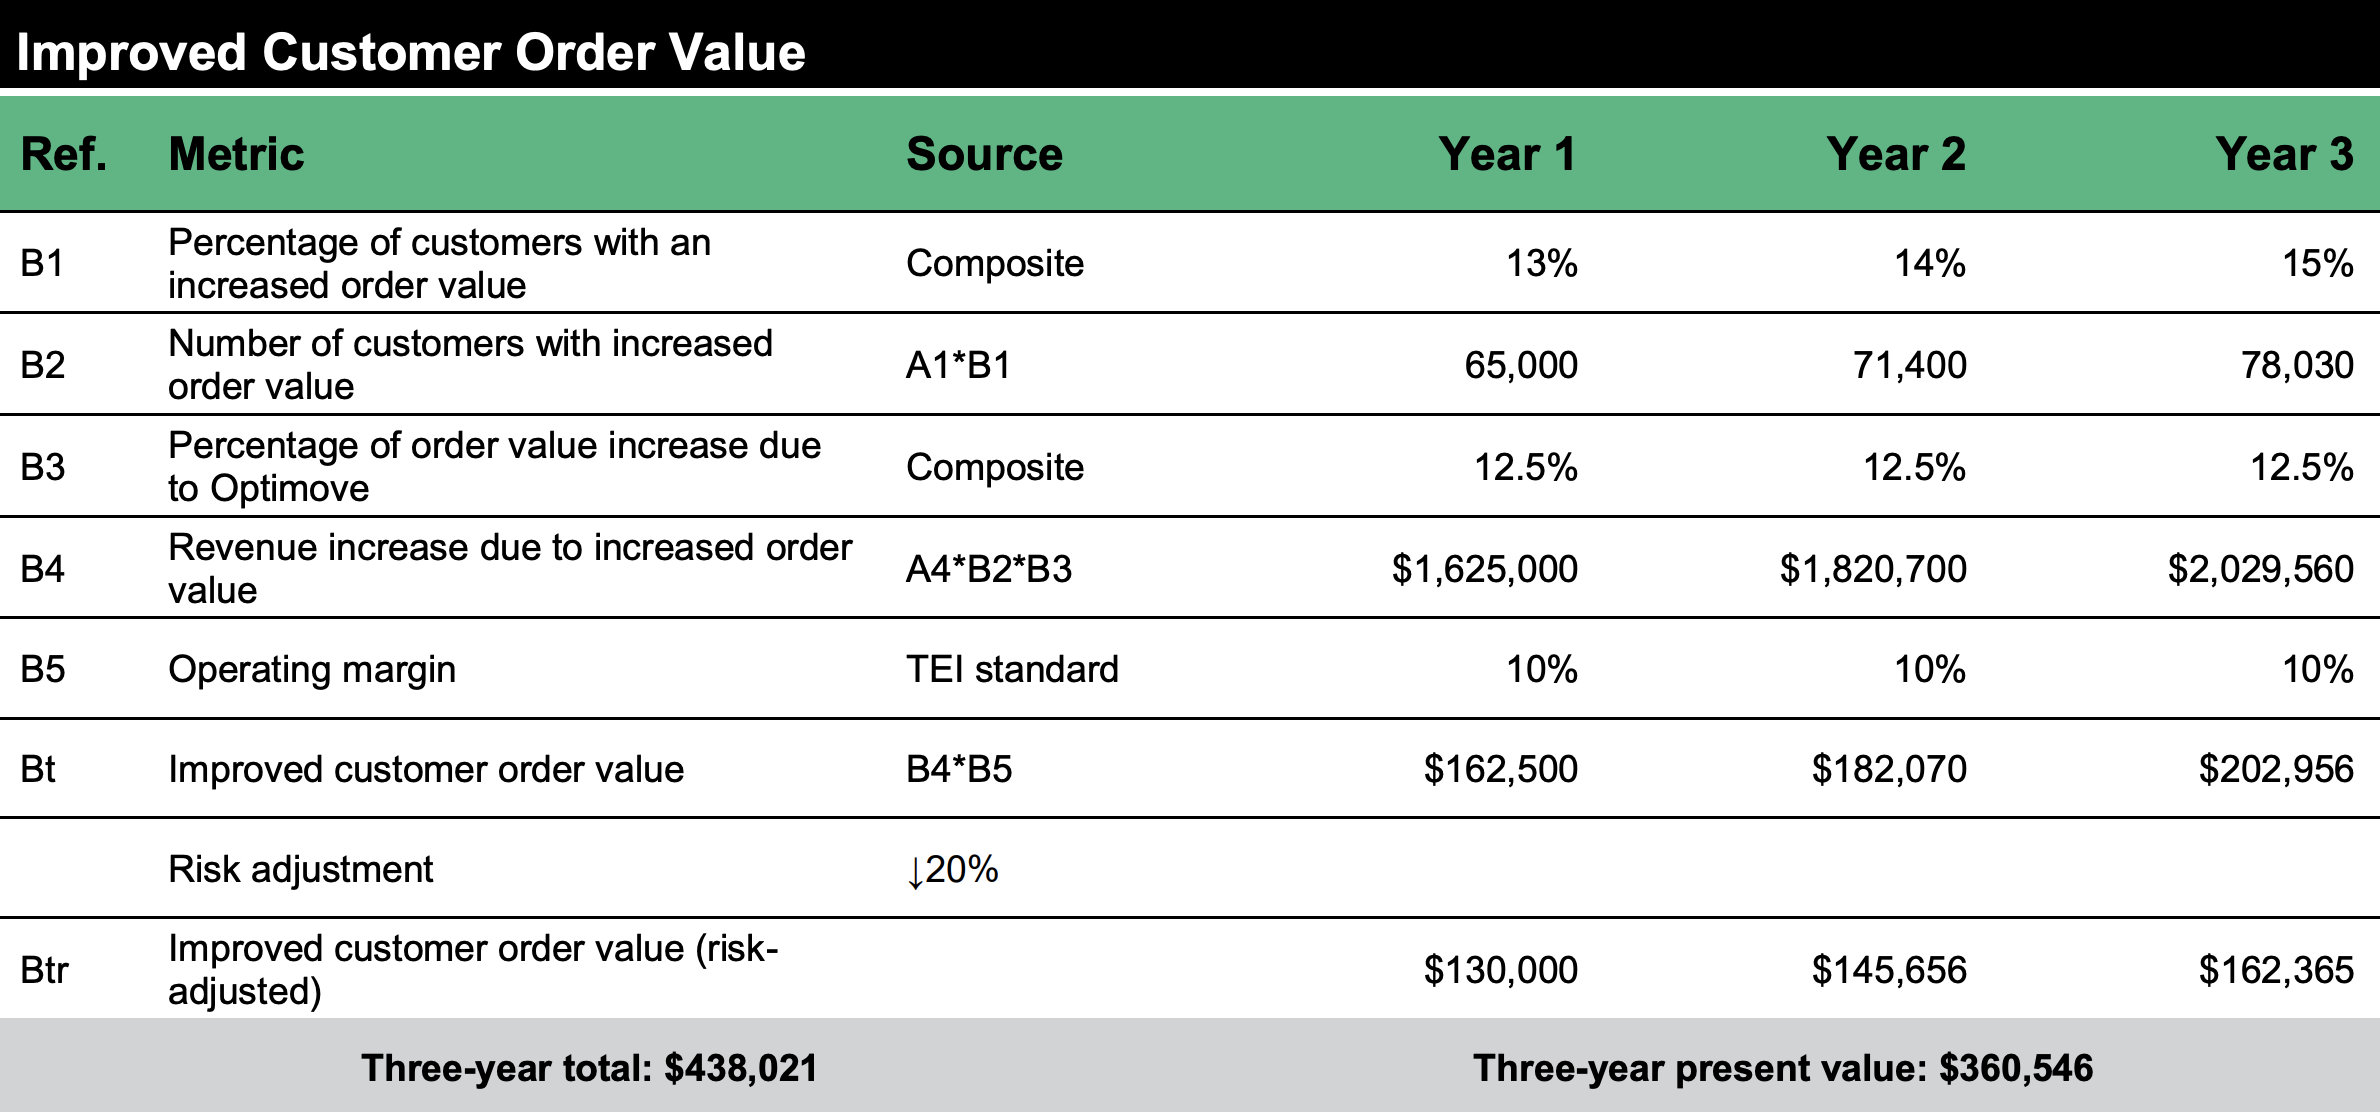
Evidence and data. With improved retention, interviewees observed an increase in customer order value for a group of customers.
Modeling and assumptions. For the analysis, Forrester assumes the following about the composite organization:
“The lifetime value is double of customers who we can market to and those that we don’t.”
VP analytics, telecommunications
Risks. Several factors could impact the outcome of this benefit, including:
Results. To account for these risks, Forrester adjusted this benefit downward by 20%, yielding a three-year, risk-adjusted total PV of $361,000.
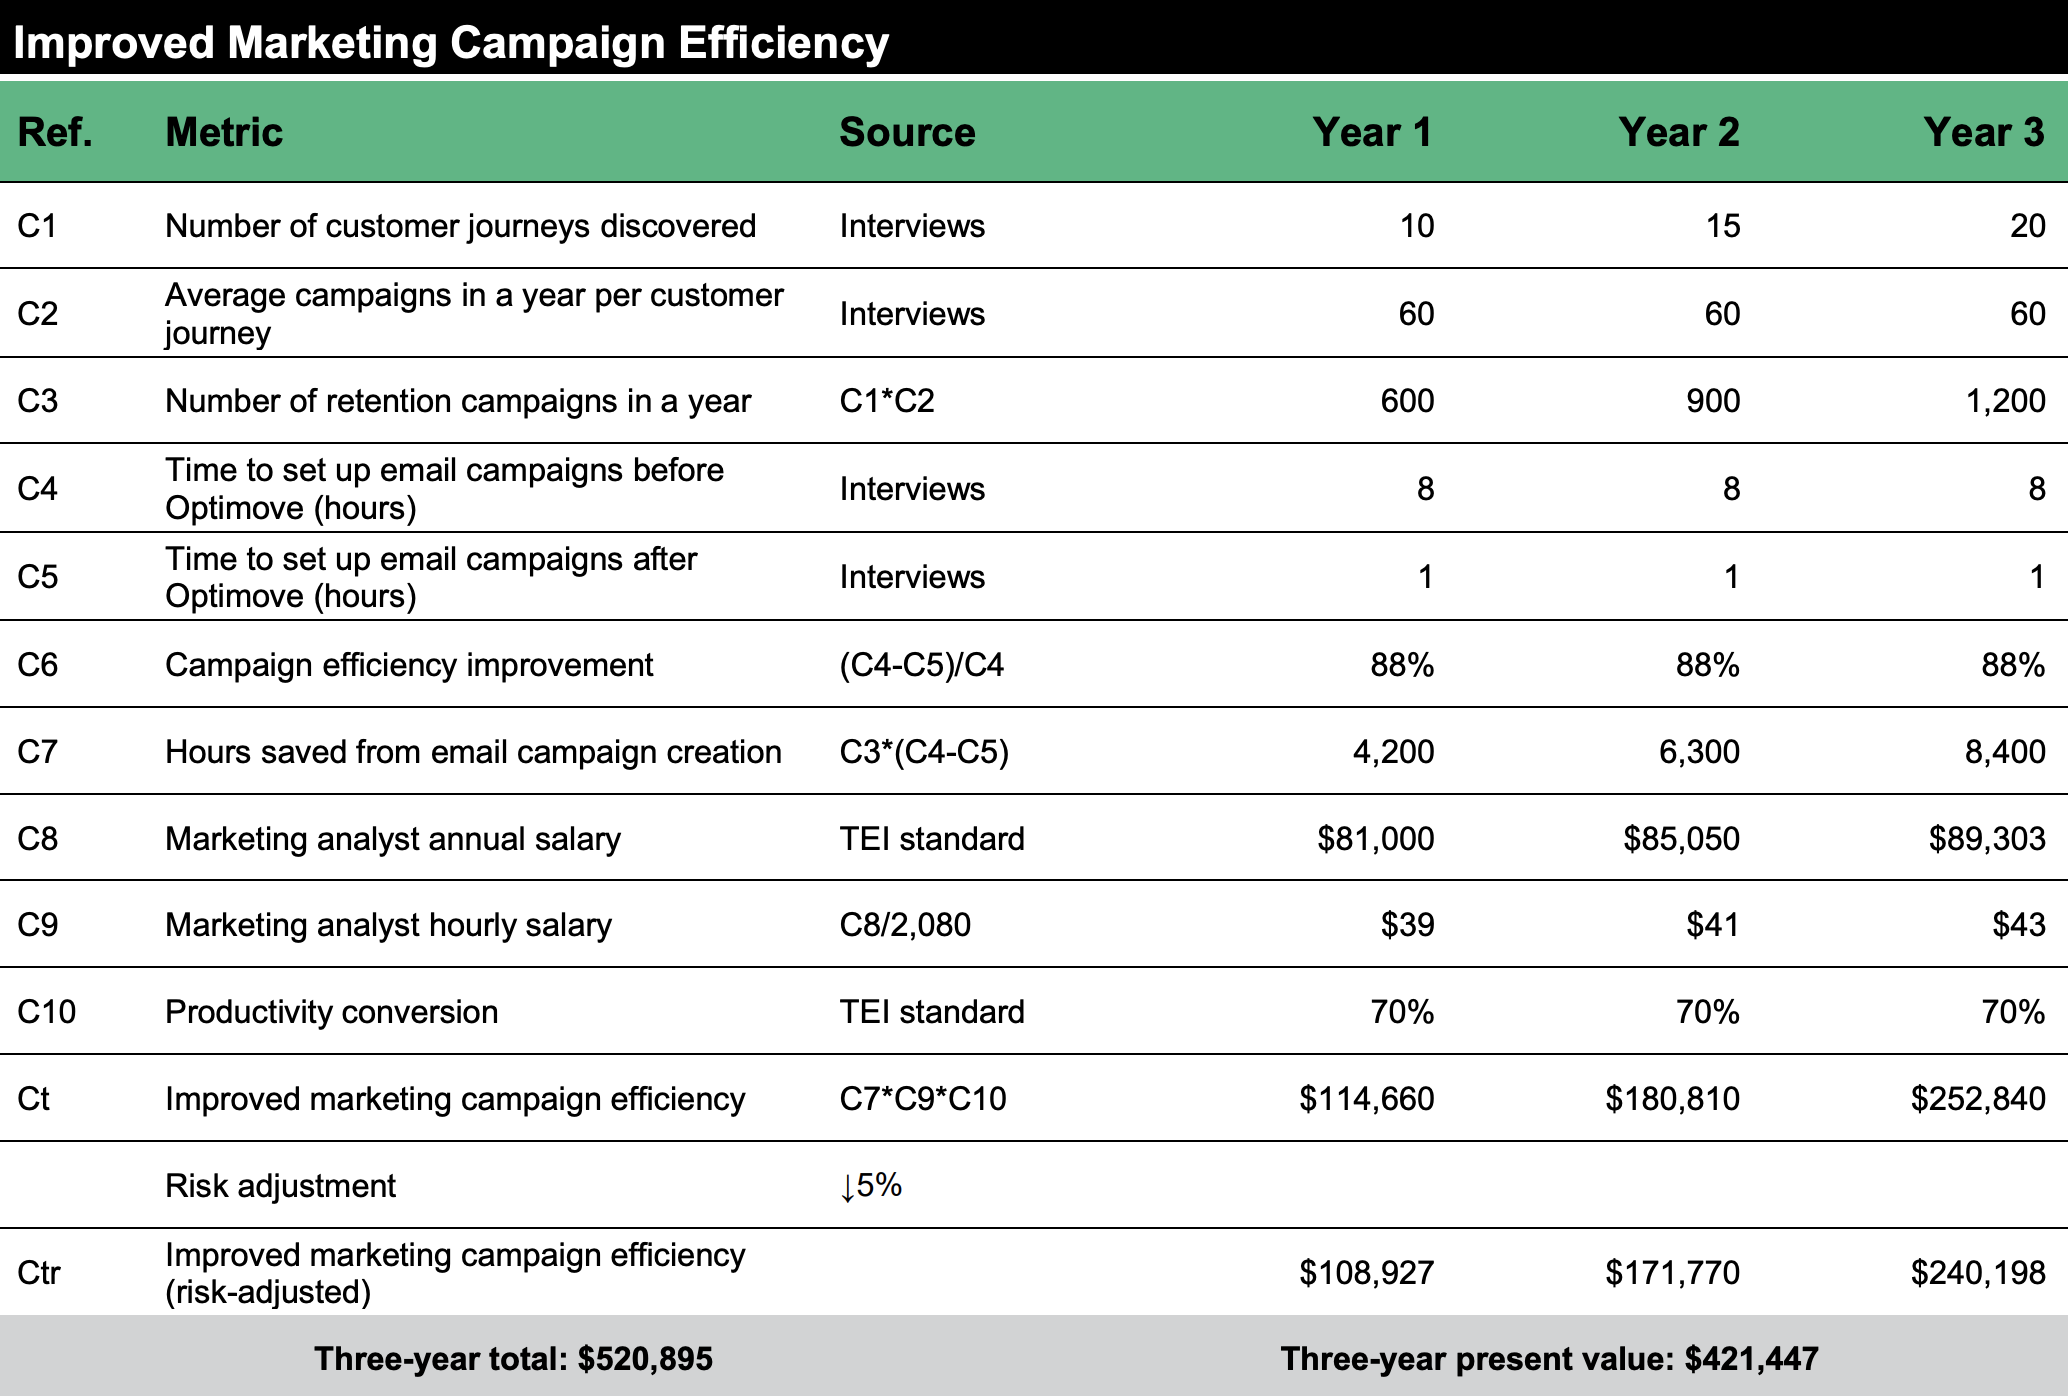
Evidence and data. Because of Optimove’s segmentation and smart orchestration capabilities, interviewees improved marketing operations efficiency, especially when it comes to campaign execution. All interviewees shared that Optimove significantly improved their efficiency in creating new campaigns, which also unleashed new opportunities for their businesses.
Modeling and assumptions. For the analysis, Forrester assumes the following about the composite organization:
Risks. Several factors could impact the outcome of this benefit, including:
Results. To account for these risks, Forrester adjusted this benefit downward by 5%, yielding a three-year, risk-adjusted total PV of $422,000.
“I think it saved us time, but it’s more than that. We have been able to be much more efficient and do so much more than we could do. We are doing what we always wanted to do, but weren’t able to.”
Head of communication, insurance
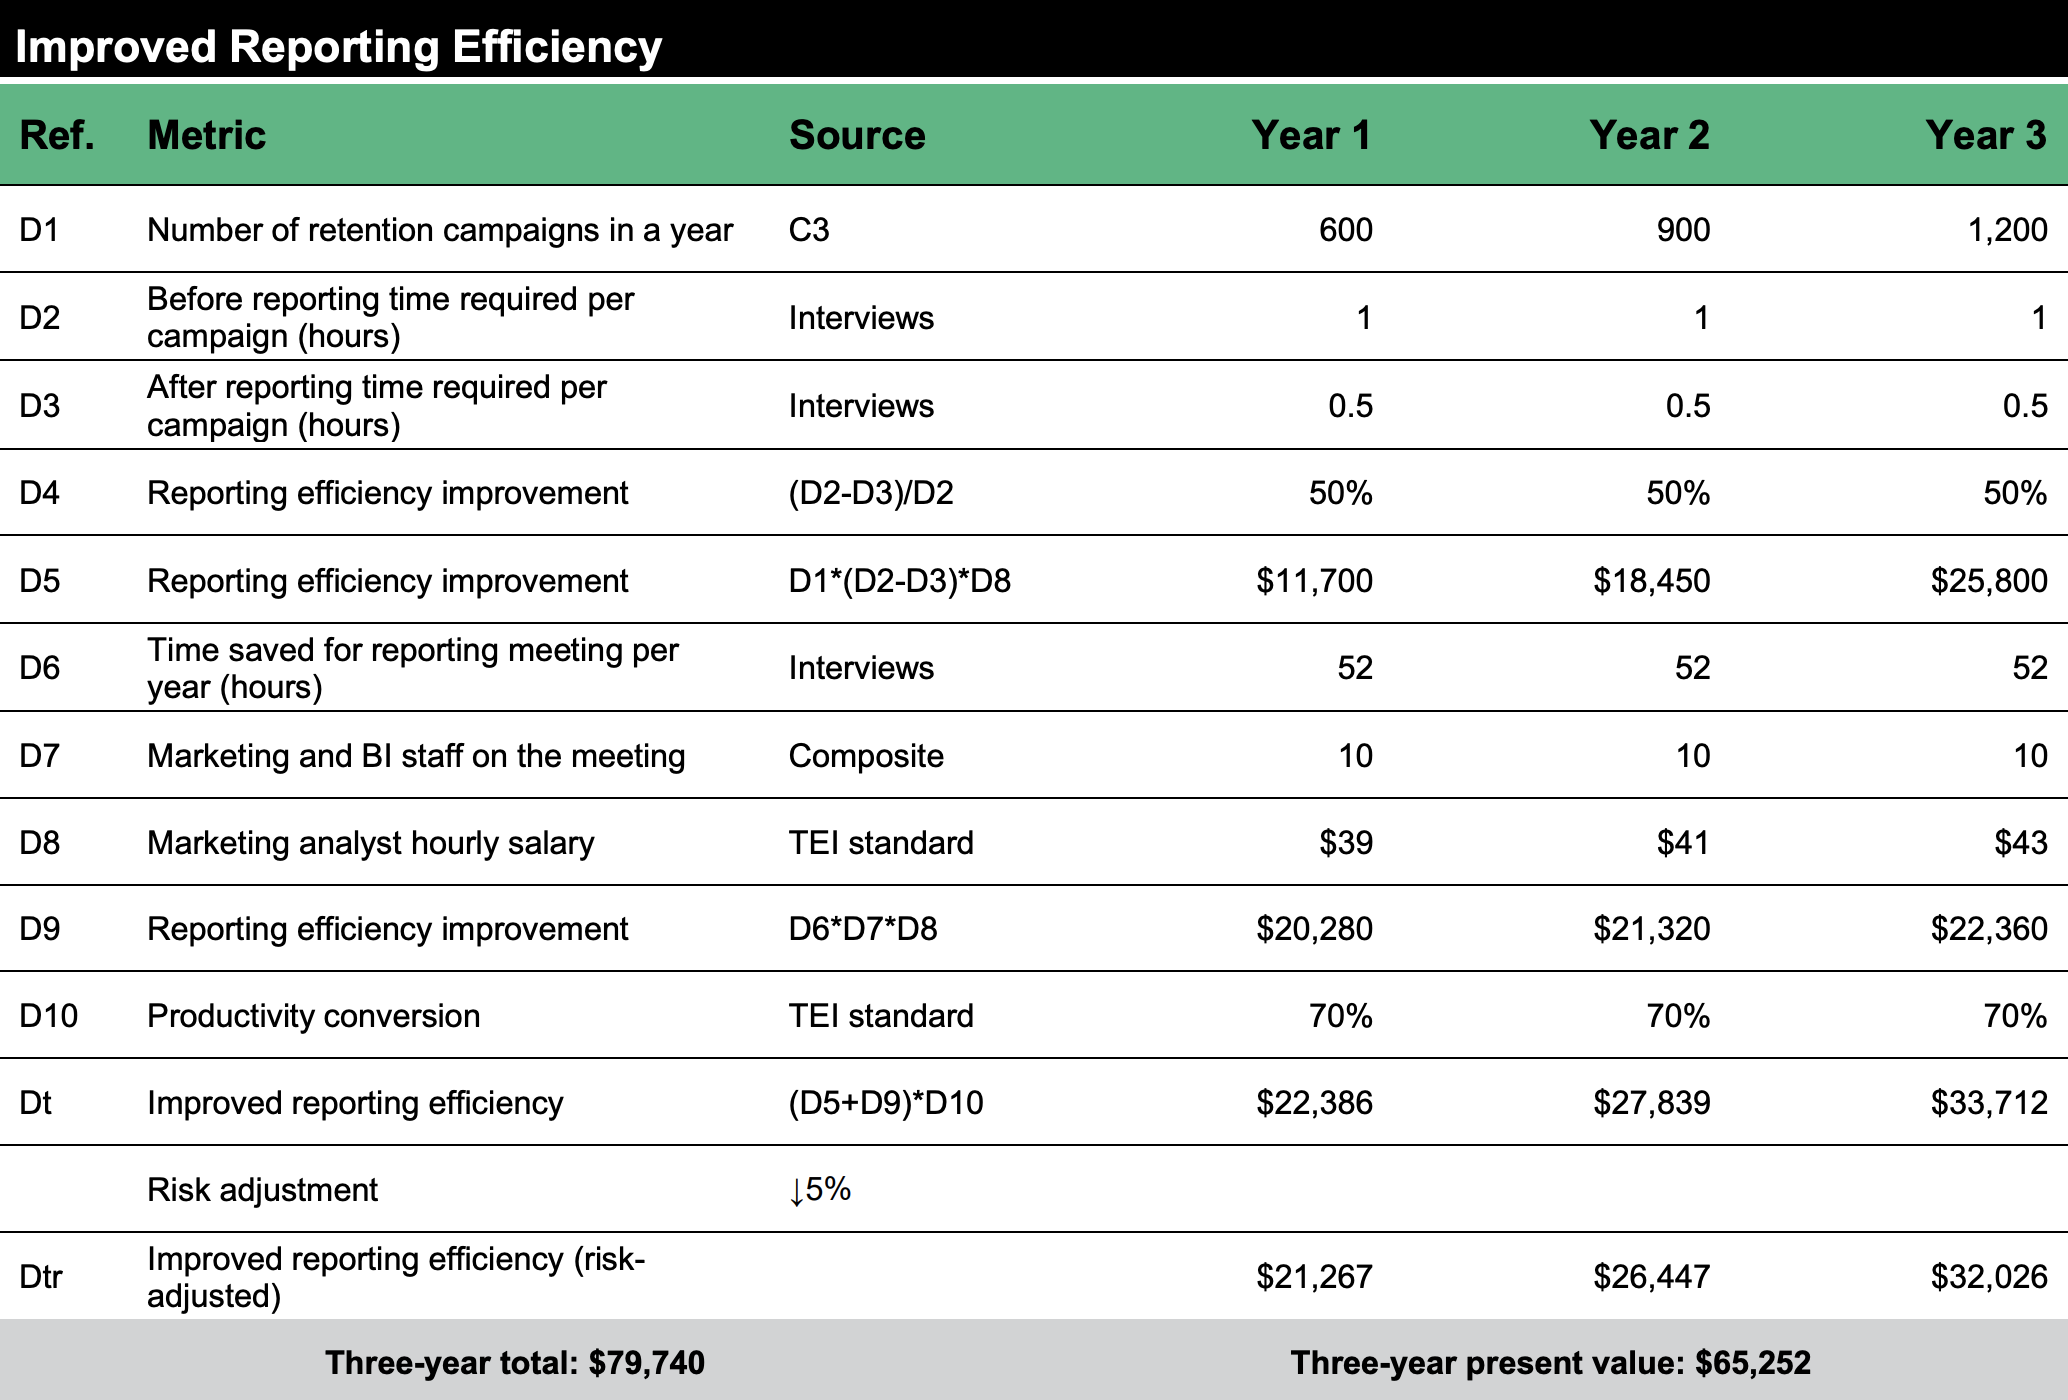
Evidence and data. After adopting Optimove, interviewees’ companies generated a single customer view and marketing campaign performance dashboards in real time.
“Four years ago, we were pulling data using simple queries, and it was really hard for us to answer business questions because it needed so much manipulation… Now, we have a lot of capabilities to build out custom reports.”
Director of marketing, CRM, and loyalty, retail
Modeling and assumptions. For the analysis, Forrester assumes the following about the composite organization:
Risks. Several factors could impact the outcome of this benefit, including:
Results. To account for these risks, Forrester adjusted this benefit downward by 5%, yielding a three-year, risk-adjusted total PV of $65,000.
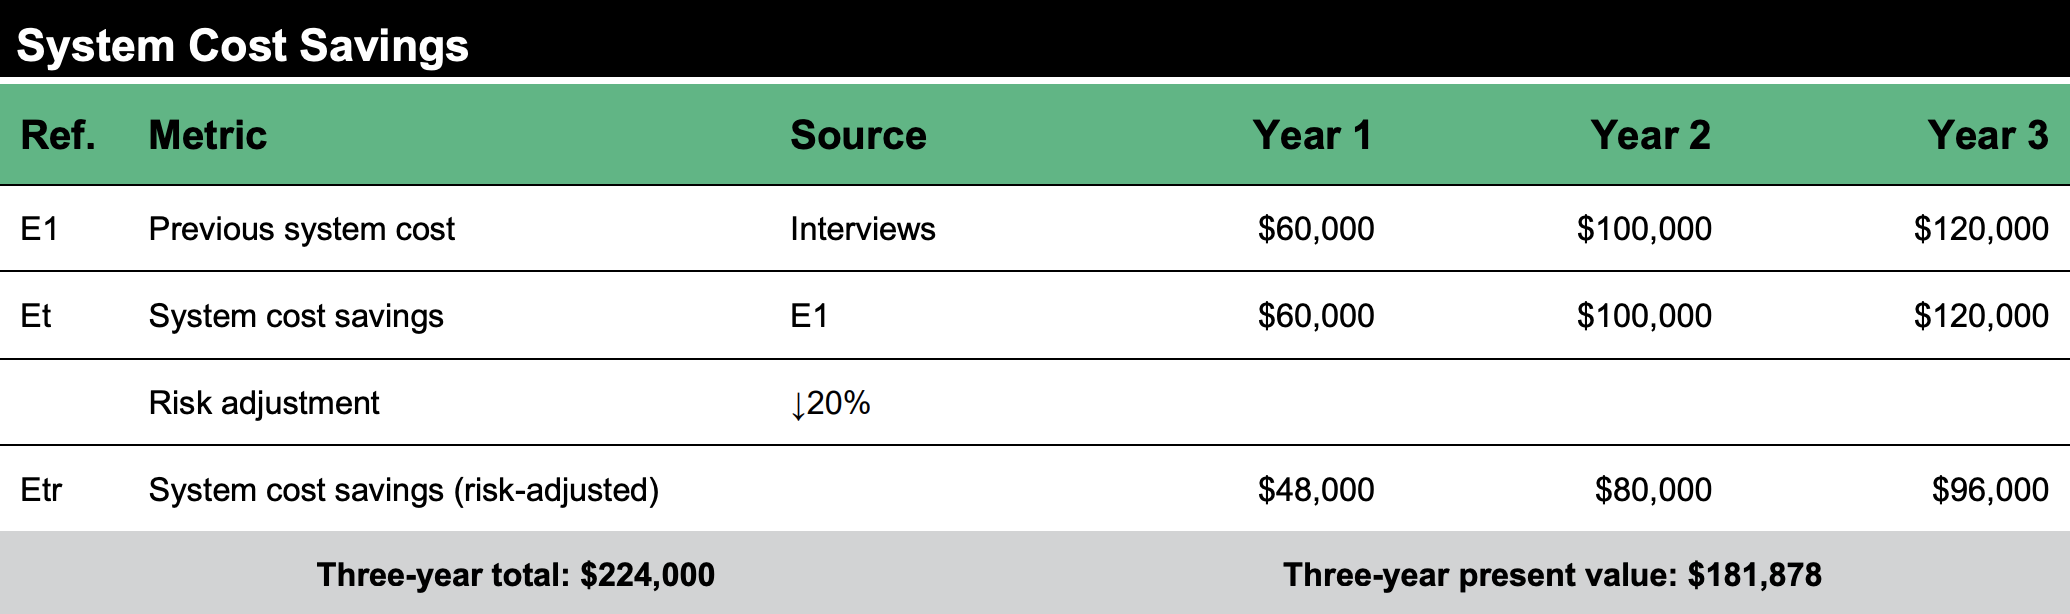
Evidence and data. Interviewees used disconnected point solutions for CRM and email automation. After onboarded Optimove, they phased out previous point solutions.
Modeling and assumptions. For the analysis, Forrester assumes the following about the composite organization:
Risks. Several factors could impact the outcome of this benefit, including:
Results. To account for these risks, Forrester adjusted this benefit downward by 20%, yielding a three-year, risk-adjusted total PV of $182,000.
Interviewees mentioned the following additional benefits that their organizations experienced but were not able to quantify:
“We’re continually expanding automations to create a map of how we engage with customers at different times via different channels.”
Head of communication, insurance
The value of flexibility is unique to each customer. There are multiple scenarios in which a customer might implement Optimove and later realize additional uses and business opportunities, including:
Flexibility would also be quantified when evaluated as part of a specific project (described in more detail in Appendix A).
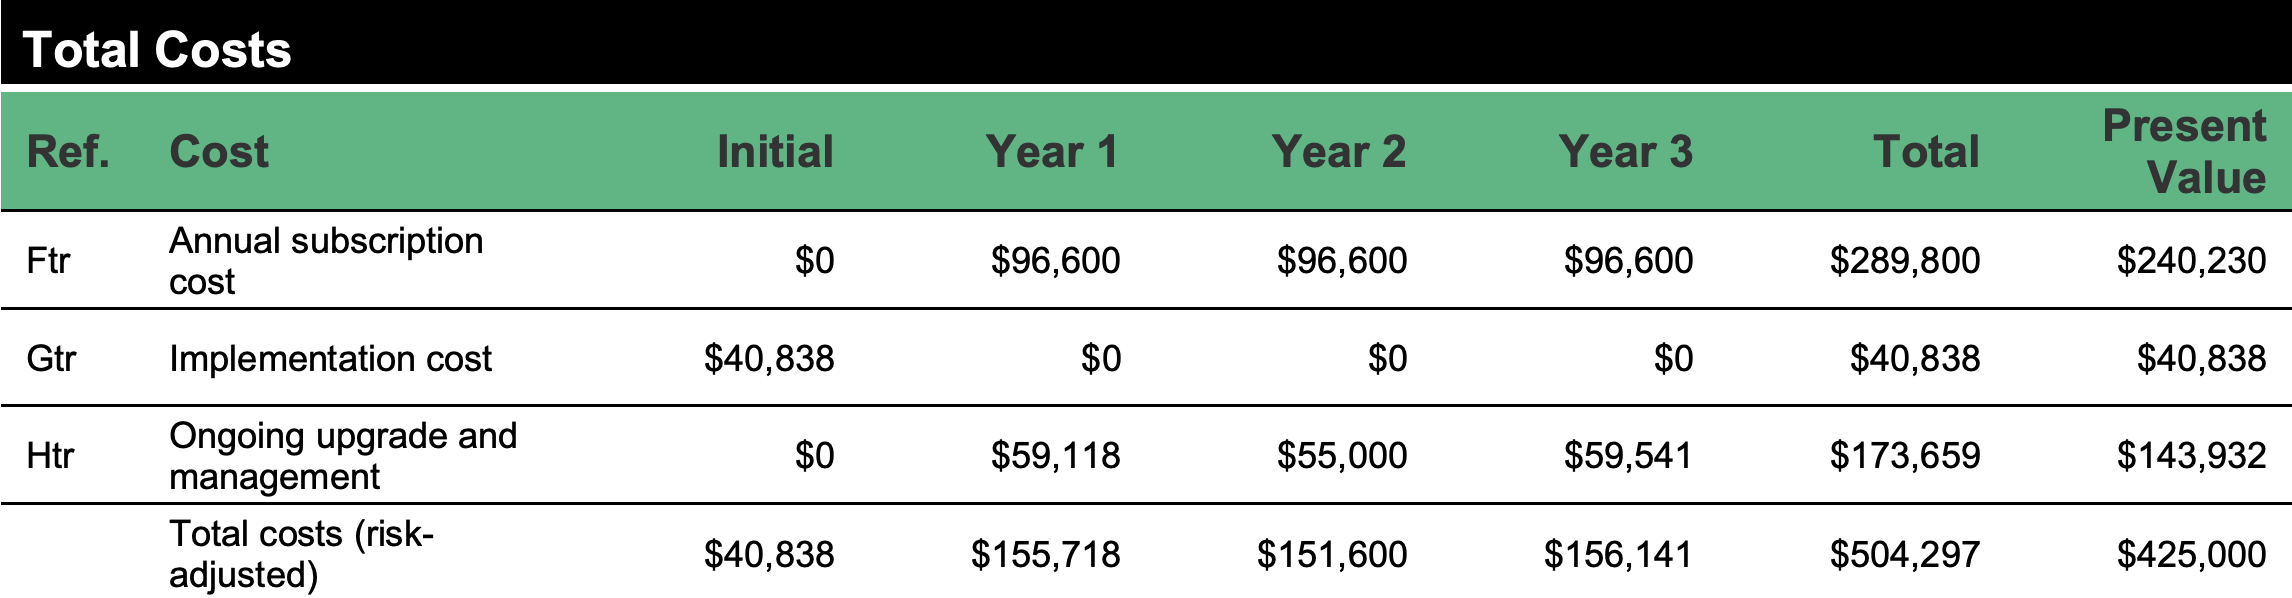
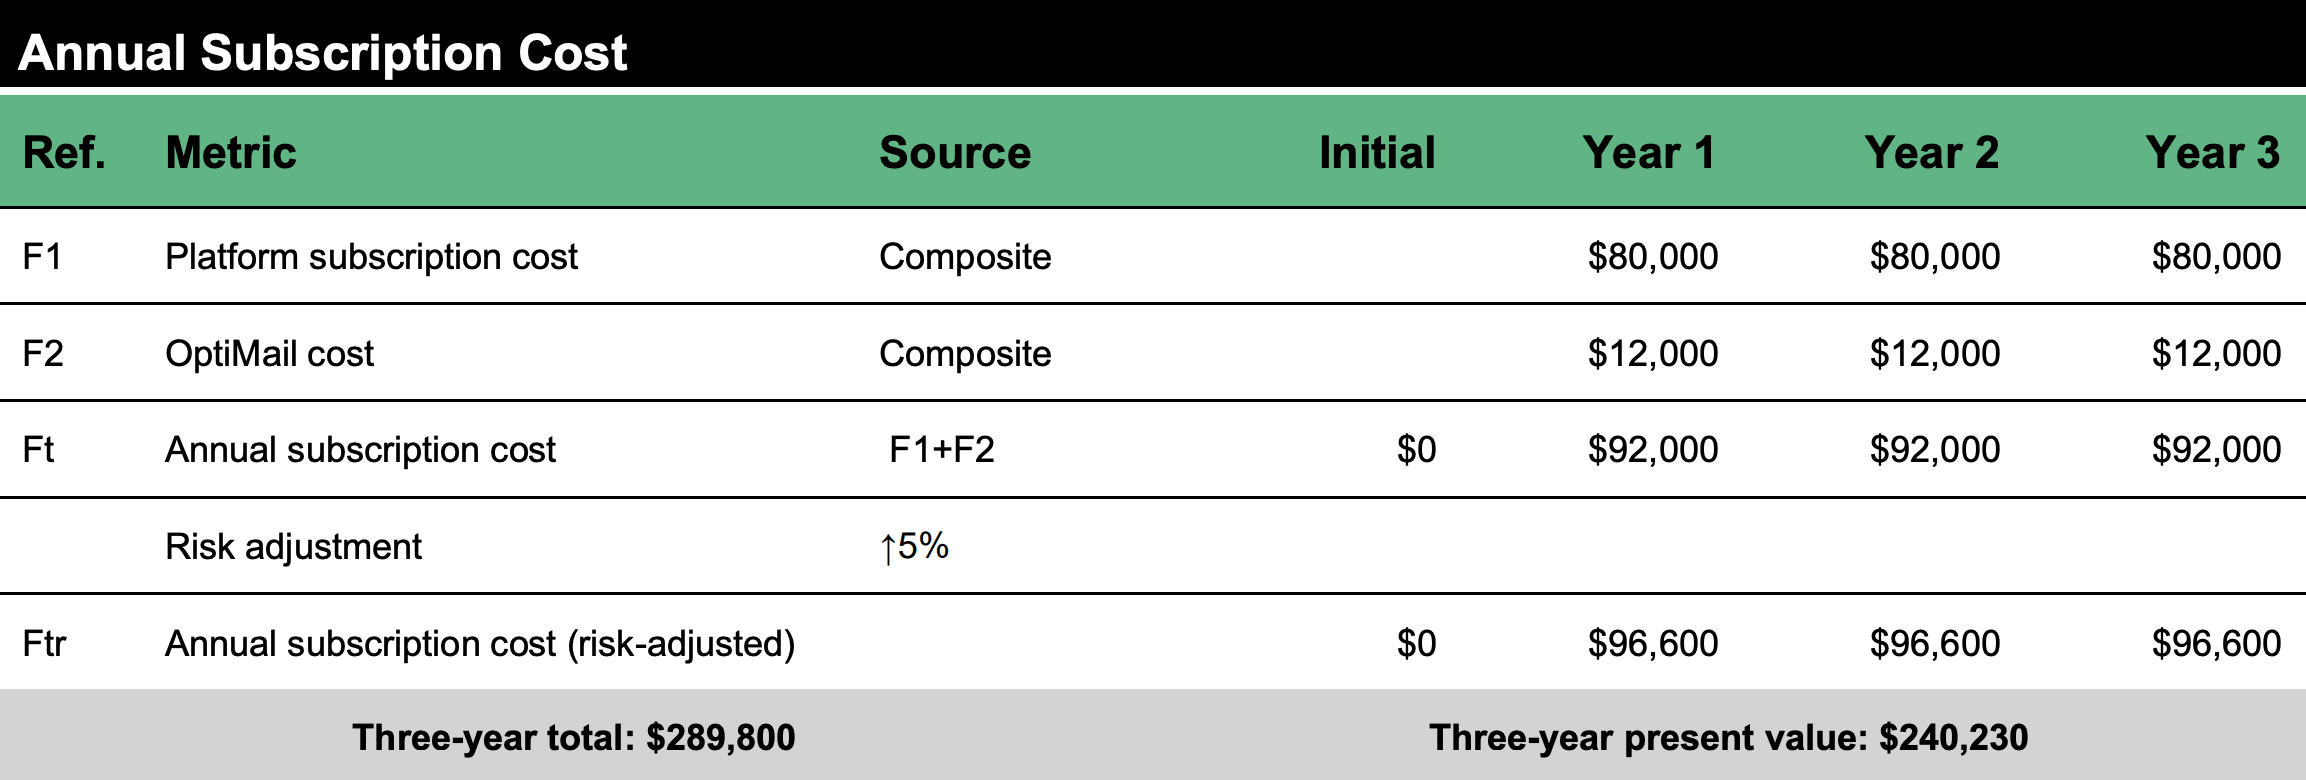
Evidence and data. The cost of the Optimove platform depended on the revenue and active customers of each interviewee’s organization.
Modeling and assumptions. For the analysis, Forrester assumes the following about the composite organization:
Risks. This model has taken the following risks into consideration:
Results. To account for these risks, Forrester adjusted this cost upward by 5%, yielding a threeyear, risk-adjusted total PV (discounted at 10%) of $240,000.
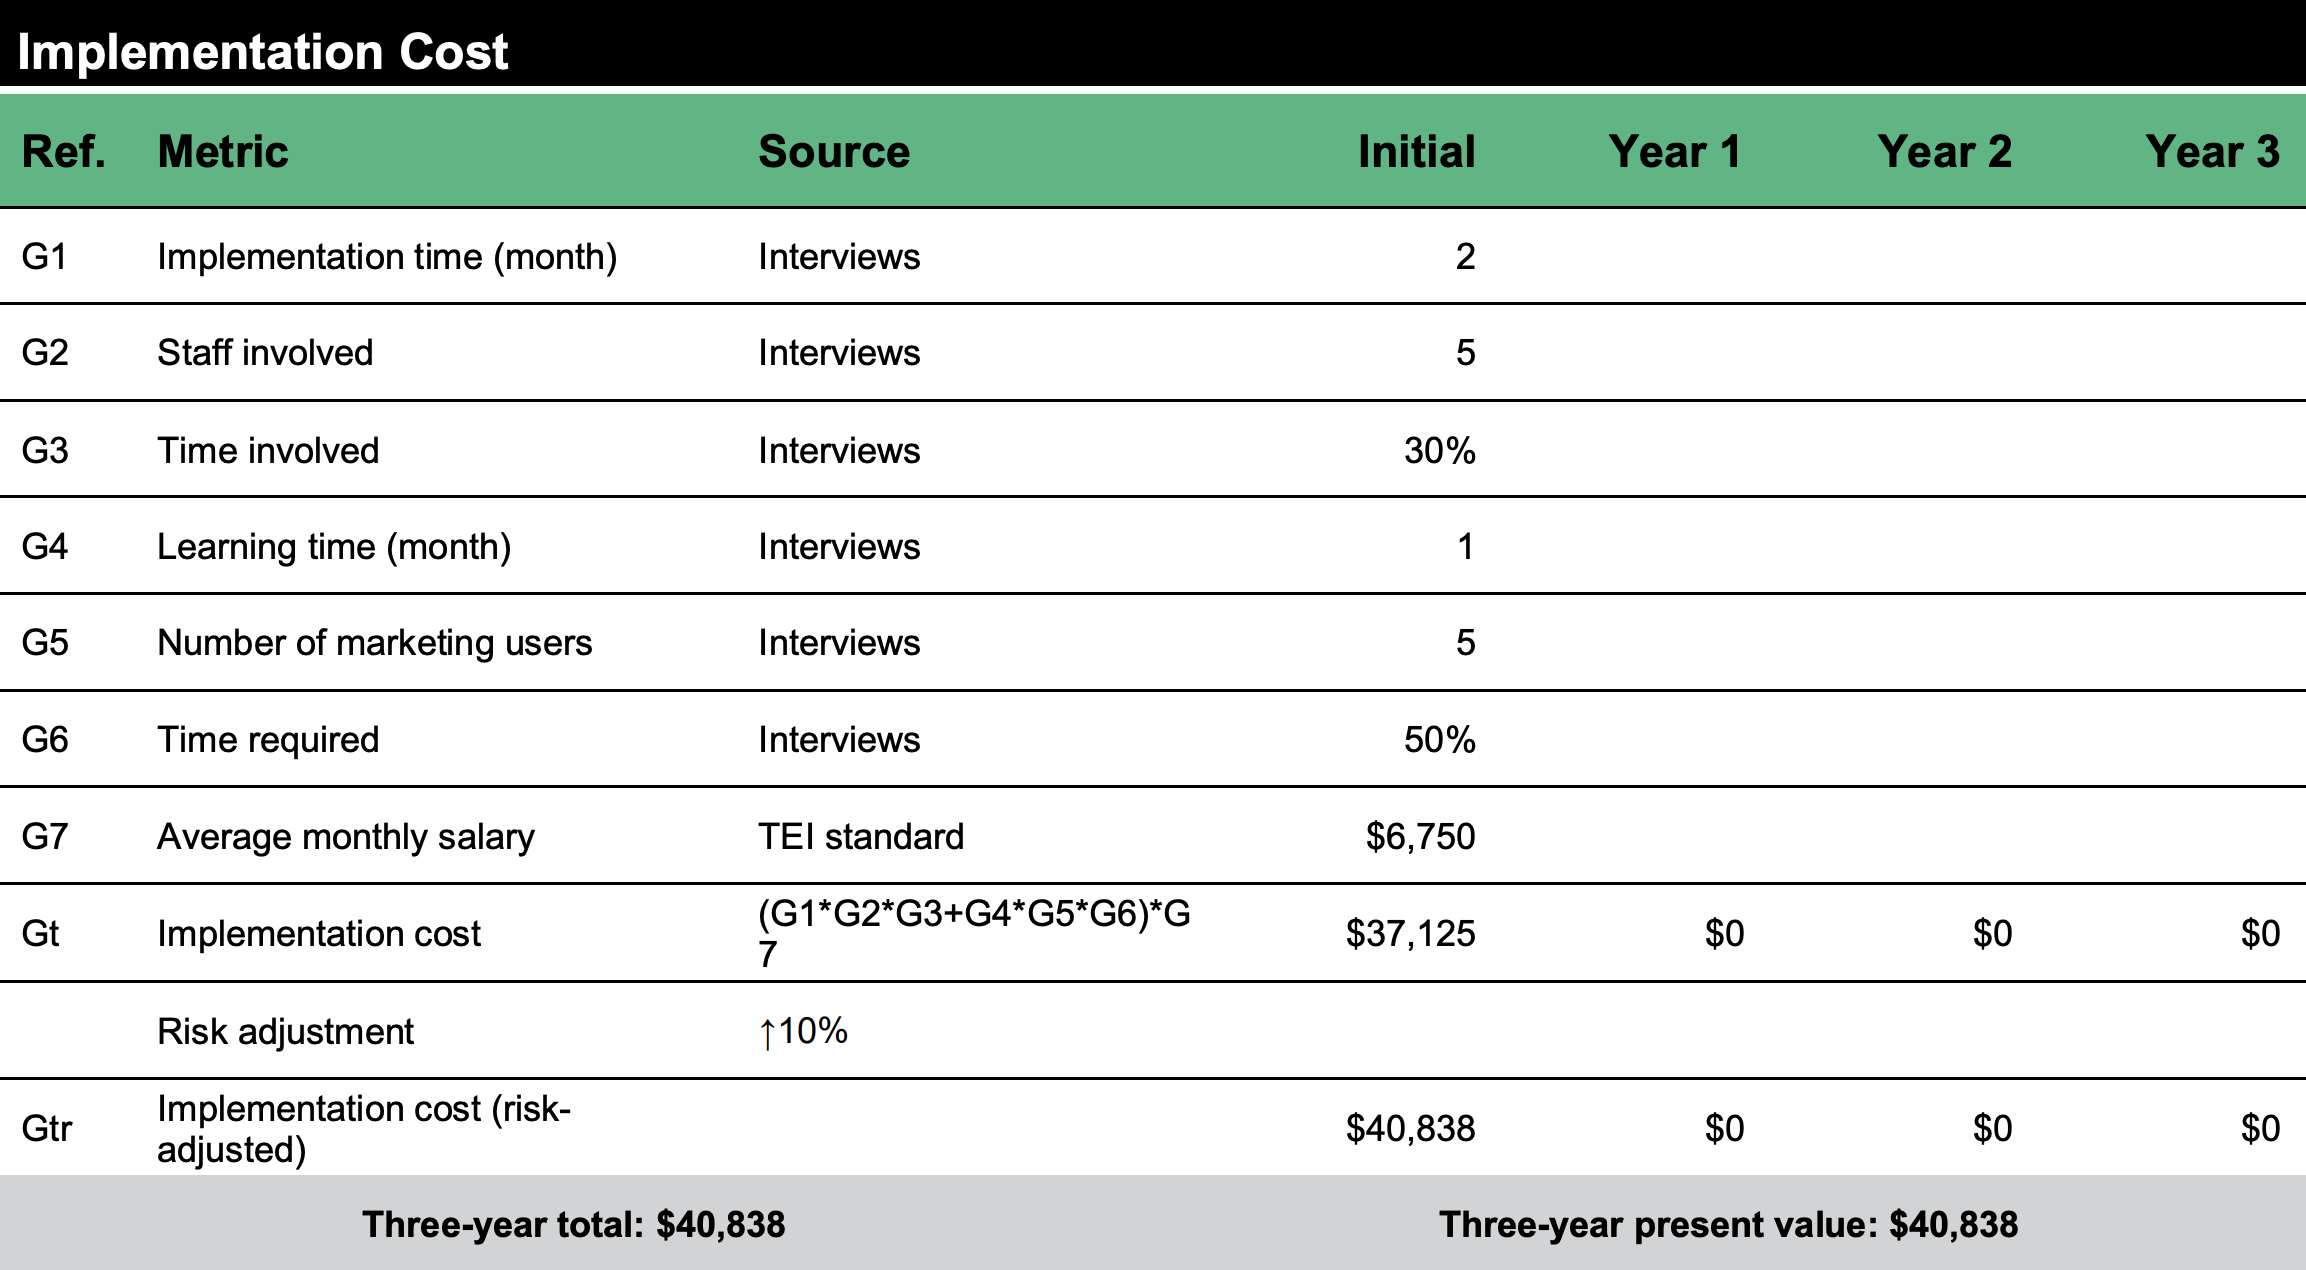
Evidence and data. Implementation costs included time and effort required throughout the implementation process and platform learning. To realize maximum value from the Optimove platform, users needed time to learn and explore its advanced functionality. Interviewees found the Optimove Academy and account managers were helpful throughout the learning process.
Modeling and assumptions. For the analysis, Forrester assumes the following about the composite organization:
Risks. This model has taken into the following risks into consideration:
Results. To account for these risks, Forrester adjusted this cost upward by 10%, yielding a threeyear, risk-adjusted total PV of $41,000.
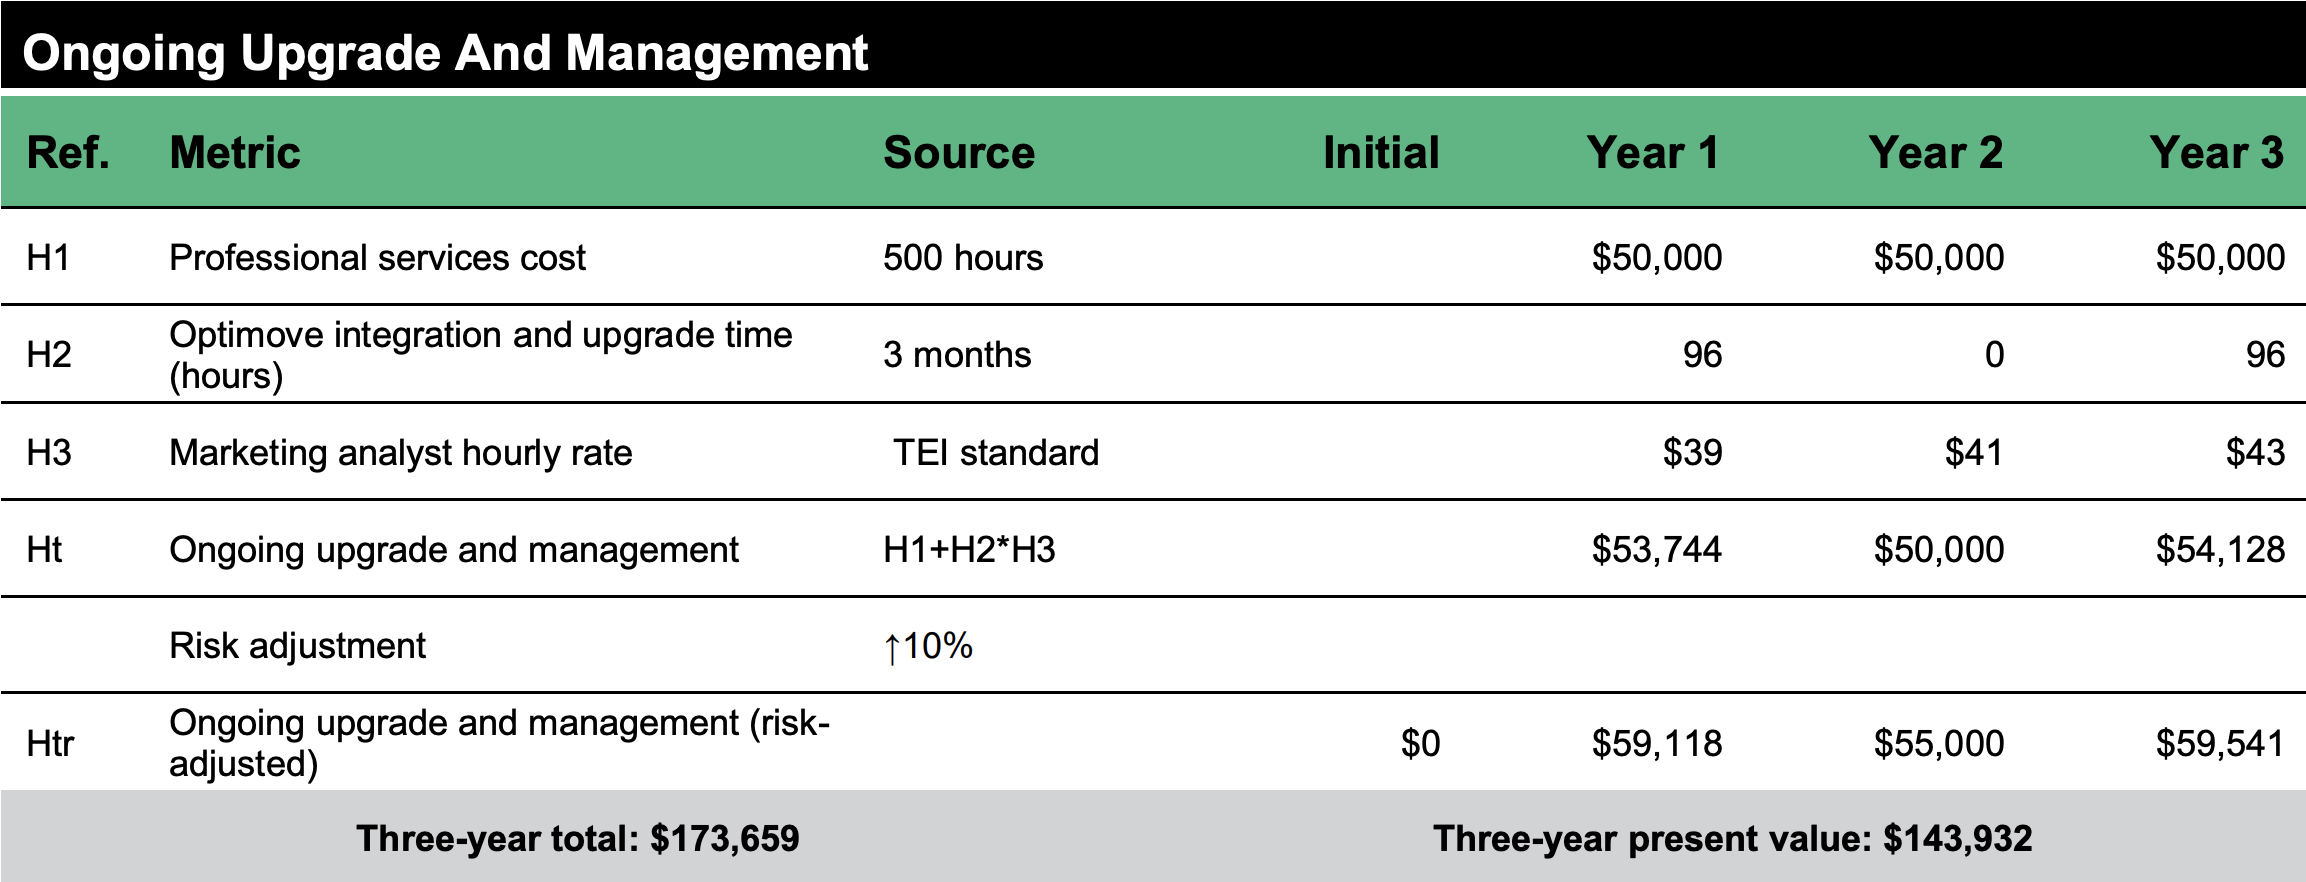
Evidence and data. Optimove required continual upgrading and management. The VP of analytics from a telecommunications firm mentioned: “What’s hard is all our custom integration points like our SMS platform, promo platform, and other proprietary solutions. It takes three to four months to get all of them tested and integrated.”
Modeling and assumptions. For the analysis, Forrester assumes the following about the composite organization:
Risks. This model has taken into the following risks into consideration:
Results. To account for these risks, Forrester adjusted this cost upward by 10%, yielding a threeyear, risk-adjusted total PV of $144,000.
The financial results calculated in the Benefits and Costs sections can be used to determine the ROI, NPV, and payback period for the composite organization’s investment. Forrester assumes a yearly discount rate of 10% for this analysis.
Cash Flow Chart (Risk-Adjusted)
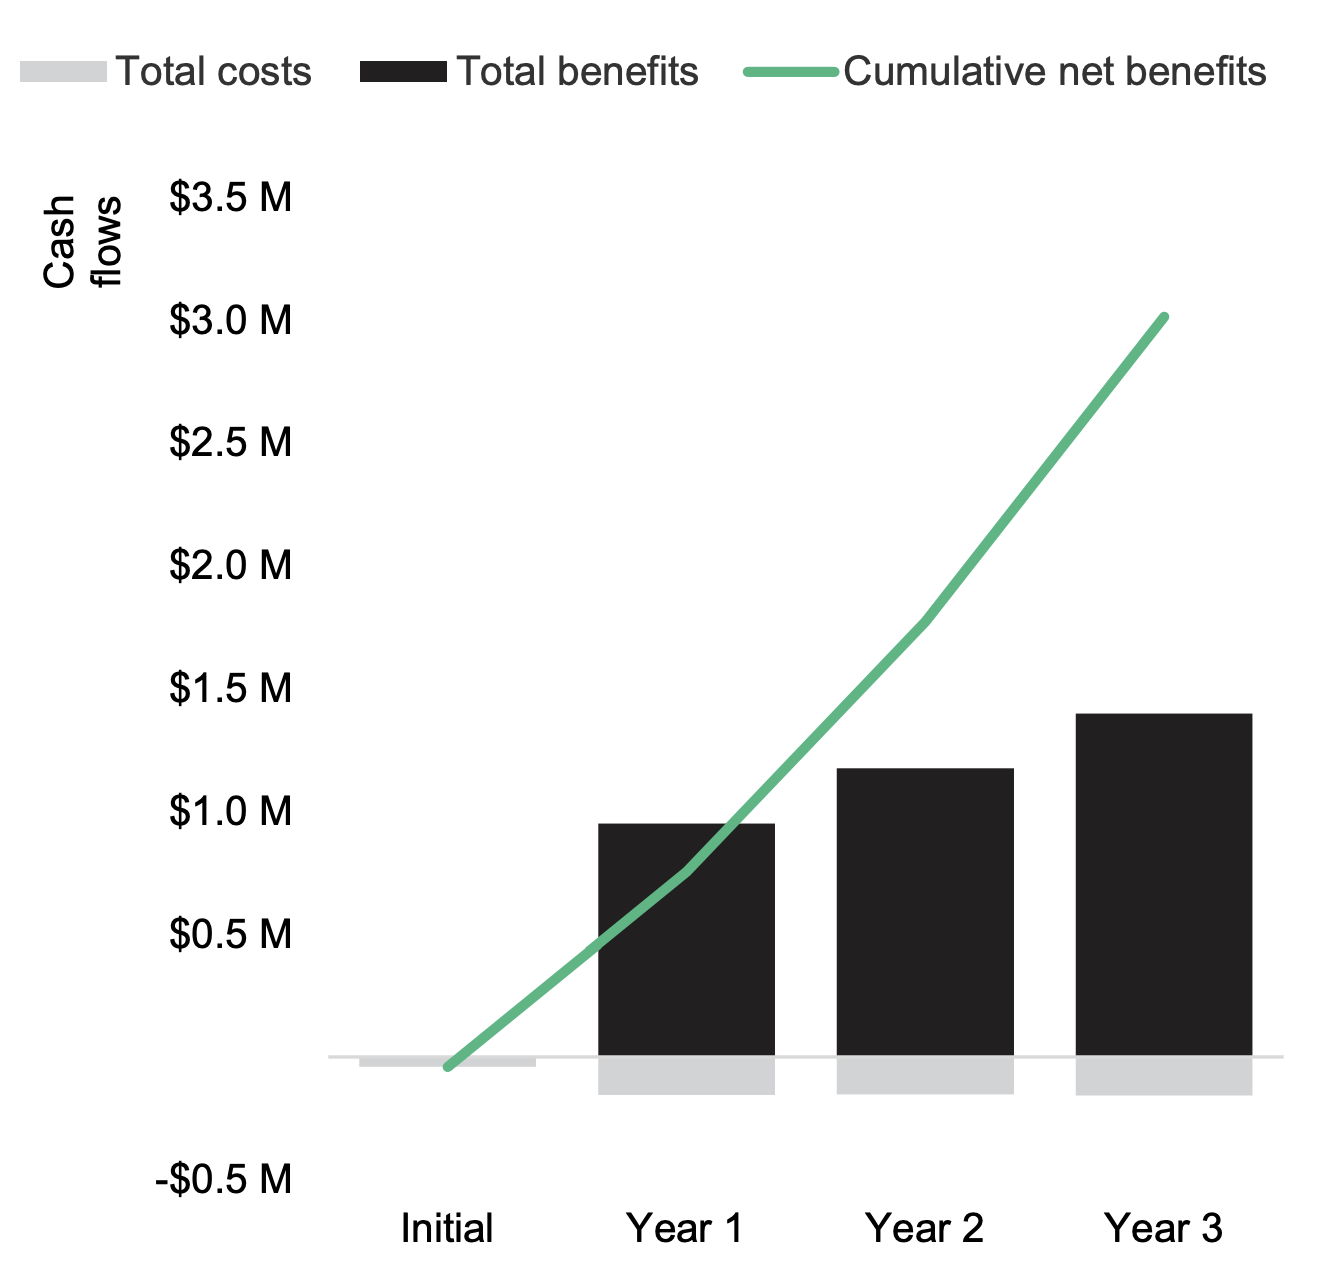
These risk-adjusted ROI, NPV, and payback period values are determined by applying risk-adjustment factors to the unadjusted results in each Benefit and Cost section.
Total Economic Impact is a methodology developed by Forrester Research that enhances a company’s technology decision-making processes and assists vendors in communicating the value proposition of their products and services to clients. The TEI methodology helps companies demonstrate, justify, and realize the tangible value of IT initiatives to both senior management and other key business stakeholders.
Benefits represent the value delivered to the business by the product. The TEI methodology places equal weight on the measure of benefits and the measure of costs, allowing for a full examination of the effect of the technology on the entire organization.
Costs consider all expenses necessary to deliver the proposed value, or benefits, of the product. The cost category within TEI captures incremental costs over the existing environment for ongoing costs associated with the solution.
Flexibility represents the strategic value that can be obtained for some future additional investment building on top of the initial investment already made. Having the ability to capture that benefit has a PV that can be estimated.
Risks measure the uncertainty of benefit and cost estimates given: 1) the likelihood that estimates will meet original projections and 2) the likelihood that estimates will be tracked over time. TEI risk factors are based on “triangular distribution.”
The initial investment column contains costs incurred at “time 0” or at the beginning of Year 1 that are not discounted. All other cash flows are discounted using the discount rate at the end of the year. PV calculations are calculated for each total cost and benefit estimate. NPV calculations in the summary tables are the sum of the initial investment and the discounted cash flows in each year. Sums and present value calculations of the Total Benefits, Total Costs, and Cash Flow tables may not exactly add up, as some rounding may occur.
PRESENT VALUE (PV)
The present or current value of (discounted) cost and benefit estimates given at an interest rate (the discount rate). The PV of costs and benefits feed into the total NPV of cash flows.
NET PRESENT VALUE (NPV)
The present or current value of (discounted) future net cash flows given an interest rate (the discount rate). A positive project NPV normally indicates that the investment should be made unless other projects have higher NPVs.
RETURN ON INVESTMENT (ROI)
A project’s expected return in percentage terms. ROI is calculated by dividing net benefits (benefits less costs) by costs.
DISCOUNT RATE
The interest rate used in cash flow analysis to take into account the time value of money. Organizations typically use discount rates between 8% and 16%.
PAYBACK PERIOD
The breakeven point for an investment. This is the point in time at which net benefits (benefits minus costs) equal initial investment or cost.
Source: “Now Tech: Customer Data Platforms, Q1 2022,” Forrester Research, Inc., February 4, 2022.
Total Economic Impact is a methodology developed by Forrester Research that enhances a company’s technology decision-making processes and assists vendors in communicating the value proposition of their products and services to clients. The TEI methodology helps companies demonstrate, justify, and realize the tangible value of IT initiatives to both senior management and other key business stakeholders.
Source: “Apply Your Data Deprecation Plan,” Forrester Research, Inc., February 1, 2021.