In my last post, I detailed how to use control groups to treat every customer campaign as a marketing experiment. The goal of each experiment is to determine how much revenue is directly attributable to the campaign. We do this by calculating the monetary uplift evident after comparing the spending behavior of the test and control groups.
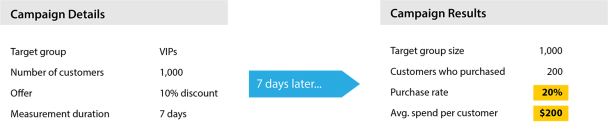
Let’s revisit the example I used in my last post: a marketer selected 1,000 VIP customers for a campaign. The marketer actually sent the campaign to 900 of the customers (the test group) and did not send it to 100 of the selected customers (the control group). 20% of the test group customers (180) made a purchase (or deposit, or trade, etc.) during the campaign measurement period, spending an average of $200. Meanwhile, 14% of the control group made a purchase during the same period, spending an average of $150 (even though they never received any offer). Based on the comparison between the two groups, we were able to determine that the revenue generated from the campaign was $17,100 (see my last post for details of this calculation).
Why Not Consider Email Open or Click Metrics?
I am sometimes asked by clients and colleagues why we measure the effectiveness of campaigns based on the entire target group for each campaign instead of looking at, for example, just those customers who opened the campaign email or clicked a link in it. In other words, shouldn’t we only be attributing customer purchases among customers who saw (or clicked) the campaign?
Consider a test group customer who never saw the campaign email (perhaps because it reached his spam folder), yet coincidentally he made a purchase during the measurement period. By including his purchase in our analysis, aren’t we undeservedly attributing a purchase to the campaign and skewing the results?
This is a good question. Read on for two excellent answers. : )
Using a Control Group Eliminates the “False Positives” Effect
As detailed in my last post, we extend the behavior of the control group to the customers in the test group. In our example, 14% of the customers in the control group spent an average of $150 despite not receiving the campaign. We therefore assume that a similar proportion of customers in the test group would have behaved similarly. Thus, we don’t measure the success of the campaign by simply looking at how much was spent by the test group (and by how many customers), but rather we normalize that spending behavior against what the control group tells us the test group would have done anyway. Assuming the results are statistically significant, we have a highly accurate indication of how successful the campaign was. (We measure statistical significance based on the difference in purchase rate and amounts between the test and control groups.)
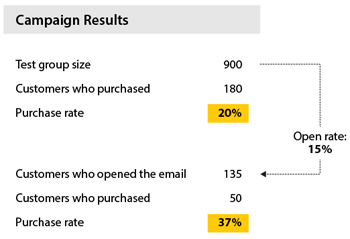
It’s worth pointing out that this approach is more conservative than only considering the purchases made by customers who opened a campaign email or clicked on it. This is because by measuring results as a percentage of the entire recipient population, the calculated response rates are lower. In other words, if we divided the number of respondents by only the number of customers who opened the email or clicked a link in the email, the response rates we obtain would be considerably higher because the denominator in the equation is that much smaller. The following tables illustrate this:
Accurate Email Metrics are Simply Not Available
A critical second reason why I don’t recommend basing campaign success measurements on email metrics is that, unfortunately, accurate metrics are simply not available. Bear with me as I delve into this important point.
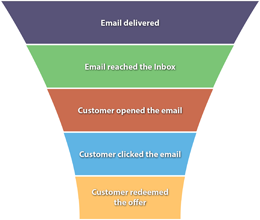
Every customer email campaign has five stages that can be analyzed. Because fewer customers are involved in each successive stage, it is useful to think of the campaign as a funnel:
1. Email delivered
2. Email reached the Inbox
3. Customer opened the email
4. Customer clicked the email
5. Customer redeemed the offer
Here are some of the reasons why each of these metrics is unreliable:
Email delivered – Email service providers (ESPs) can tally the emails which were undeliverable (“bounced”), but they have no way of knowing which emails were never delivered even when they didn’t bounce. This includes situations where an email was “lost” en route before being delivered and where a bounce notification was never sent (or never arrived) to the sending server.
Email reached the Inbox – ESPs have no way to know that a successfully delivered email ever reached the user’s email inbox. This could be the case when an email server blocked the message after identifying it as spam or if the user’s email client automatically filed the email into an unused folder (spam or other).
Customer opened the email – Theoretically, ESPs are able to identify every recipient who opened an email via a tracking image embedded (linked) in the email. In practice, however, this is not a reliable metric for a number of reasons: many email clients will not automatically download embedded images, while others may download images in emails that the user never opened. (For much more detail about why email open rates are problematic, I recommend reading this Wikipedia article and this Smart Insights article.) There is also the possibility that some customers noticed the subject line and were reminded of the brand (possibly the direct cause of a purchase), even though they never actually opened the email.
Customer clicked the email – While this is a metric that an ESP can measure accurately – because every click results in a call to the ESP’s server which redirects the recipient to the actual target page – it ignores every time a customer saw the email and, as a result, went directly to the website without clicking the email itself. Every time the customer makes a desired transaction on the website after seeing a campaign email, even without clicking on it, this metric becomes more inaccurate as a key campaign success metric.
Customer redeemed the offer – Although it would seem that this would be the ultimate success measure, our experience shows a surprising disconnect between the number of customers who redeem an offer (e.g., obtained a coupon, entered a discount code) and those who ultimately made a desirable transaction. One example is customers who receive a coupon or discount code and proceed to make a purchase and forget to use the coupon/code. Another example are customers who activate the coupon code and make a purchase (or a deposit) but do not reach the threshold for the coupon/code to kick in (i.e., the total order or deposit amount was not enough to trigger the incentive).
Of course, many non-email campaign channels (e.g., push notifications, message boards, direct mail) provide even less data about what each customer saw or did. Thus, looking at the monetary uplift across all recipients is even more important.
Conclusion
The bottom line is that, while there would be value in assessing aspects of customer campaigns in terms of certain email metrics, these metrics are simply not reliable enough for determining campaign success. On the other hand, the test/control experiment method of assessing campaign performance is accurate, reliable and sufficiently representative for determining the uplift generated by any customer campaign.
Pini co-founded Optimove in 2012 and has led the company, as its CEO, since its inception. With two decades of experience in analytics-driven customer marketing, business consulting and sales, he is the driving force behind Optimove. His passion for innovative and empowering technologies is what keeps Optimove ahead of the curve. He holds an MSc in Industrial Engineering and Management from Tel Aviv University.